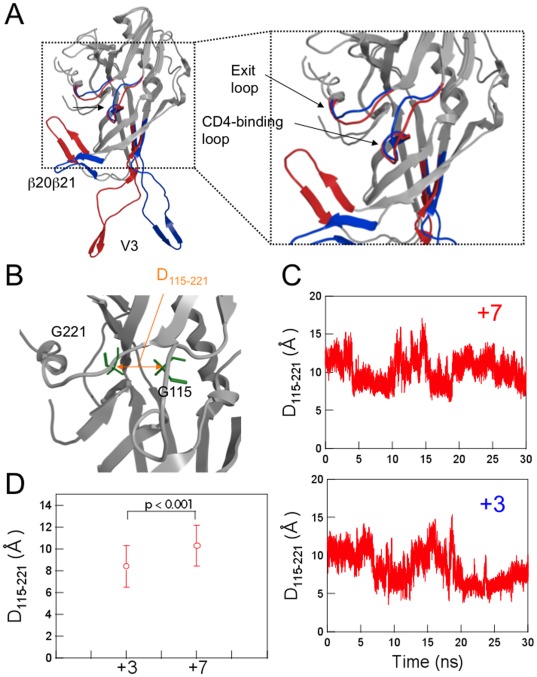
Figure 2. Comparison of the averaged 3-D models during MD simulation.
(A) Superposition of the averaged structures obtained with the 40,000 snapshots obtained from 10–30 ns of MD simulations using ptraj module in Amber 9. Red and Blue ribbons: loops of Gp120LAI-NH1V3 and Gp120LAI-TH09V3 with V3 net charges of +7 and +3, respectively. (B–D) Configuration and structural dynamics of the CD4 binding loop. The distance between the Cα of Gly115 and the Cα of Gly221 in the CD4 binding loop was calculated to monitor configurational changes (B). The distance was monitored during the 10–30 ns of MD simulation (C) and the average distance with variance was plotted (D). +7: Gp120LAI-NH1V3; +3: Gp120LAI-TH09V3.

