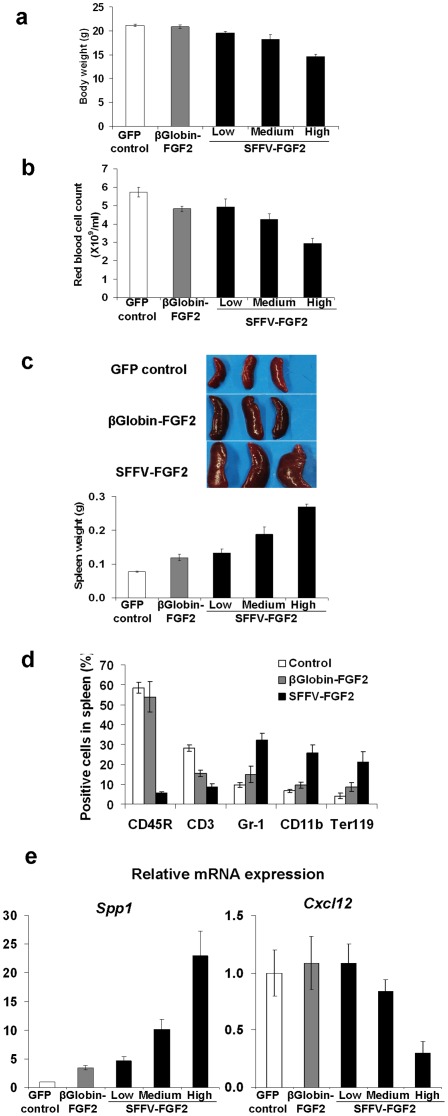
Figure 3. Confined FGF2 expression eliminates high-level FGF2 associated anemia and ameliorates extramedullary hematopoiesis.
(a) FGF2 negatively affects body weight. Mice were weighed at 8 weeks after transplantation. GFP control vs. β-globin-FGF2, not significant; GFP control vs. low SFFV-FGF2, P<0.05; GFP control vs. medium SFFV-FGF2, P<0.001; GFP control vs. high SFFV-FGF2, P<0.001. (b) FGF2 negatively affects red blood cell count. Red blood cells in peripheral blood were counted at 8 weeks after transplantation. GFP control vs. β-globin-FGF2, P<0.05; GFP control vs. low SFFV-FGF2, P<0.05; GFP control vs. medium SFFV-FGF2, P<0.01; GFP control vs. high SFFV-FGF2, P<0.001. (c) FGF2 induces extramedullary hematopoiesis in a concentration-dependant manner. Shown are representative spleens and the spleen weight in different groups. GFP control vs. β-globin-FGF2, P<0.05; GFP control vs. low SFFV-FGF2, P<0.05; GFP control vs. medium SFFV-FGF2, P<0.01; GFP control vs. high SFFV-FGF2, P<0.001. (d) Flow cytometry analysis of CD45R+ B cells, CD3+ T cells, Gr-1+ and CD11b+ myeloid cells, and Ter119+ erythroid cells in spleens from the GFP control mice, the β-globin-FGF2 mice and the high SFFV-FGF2 mice at 8 weeks after transplantation. (e) Relative mRNA expression of Spp1, and Cxcl12 in femurs from the GFP control mice, the β-globin-FGF2 mice and the high SFFV-FGF2 mice. For Spp1, GFP control vs. all the other groups, P<0.001. For Cxcl12, GFP control vs. high SFFV-FGF2, P<0.001; others, GFP control vs. other groups, not significant. Data shown are presented as mean ± SEM (n = 10 mice/group).

