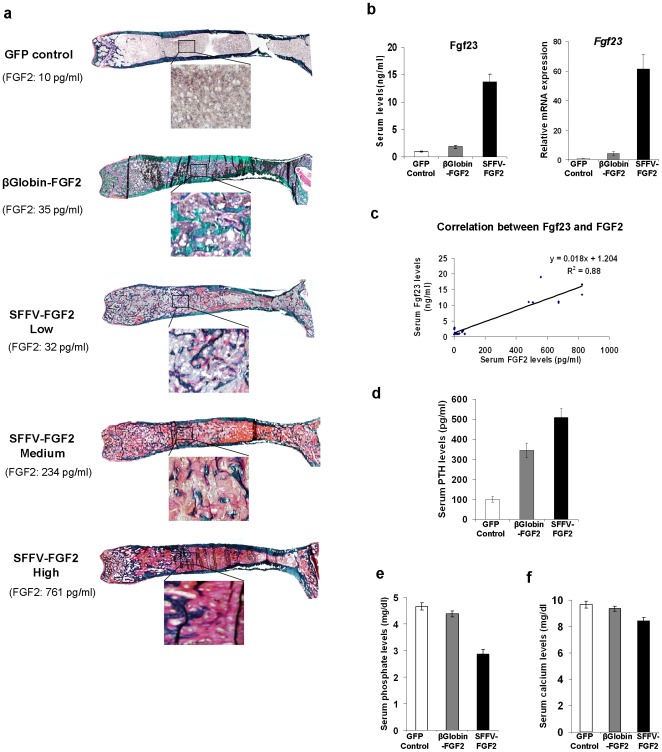
Figure 4. Confined FGF2 expression abrogates high-level FGF2-associated osteomalacia.
(a) Representative illustration of Goldner's trichrome staining of femurs from each group. Green indicates mineralized bone and red or pink unmineralized bone. (b) Serum Fgf23 levels and relative Fgf23 mRNA expression in femurs from the GFP control mice, the β-globin-FGF2 mice and the high SFFV-FGF2 mice. P<0.001 for all comparisons. (c) Serum Fgf23 is positively correlated with serum FGF2 levels. P<0.001. (d). Serum levels of PTH. P<0.001 for all comparisons. (e) Serum phosphate levels. GFP control vs. β-globin-FGF2, P = 0.06; P<0.001 for all the other comparisons. (f) Serum calcium levels. GFP control vs. β-globin-FGF2, P = 0.40; P<0.01 for all the other comparisons. Data shown are presented as mean ± SEM (n = 10 mice/group).

