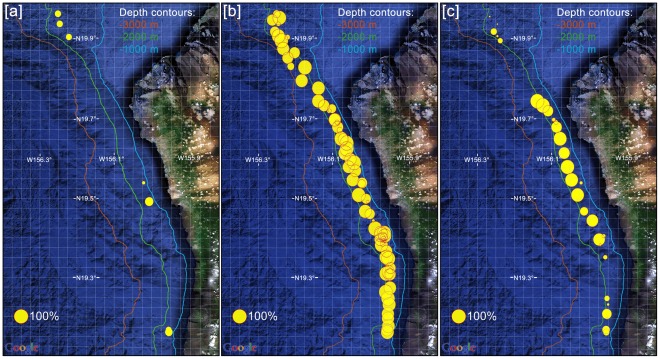
Figure 2. Locations of acoustic encounters as derived from the manual data analysis.
Panels indicate locations of [a] beaked whale, [b] delphinid, and [c] sperm whale acoustic encounters. Size of each dot represents the percentage (logarithmic scale) of acoustic data recorded per glider dive containing respective target signal. Map source: Google Earth. Contours: Hawai'i Mapping Research Group, School of Ocean and Earth Sciences and Technology, University of Hawai'i, USA.

