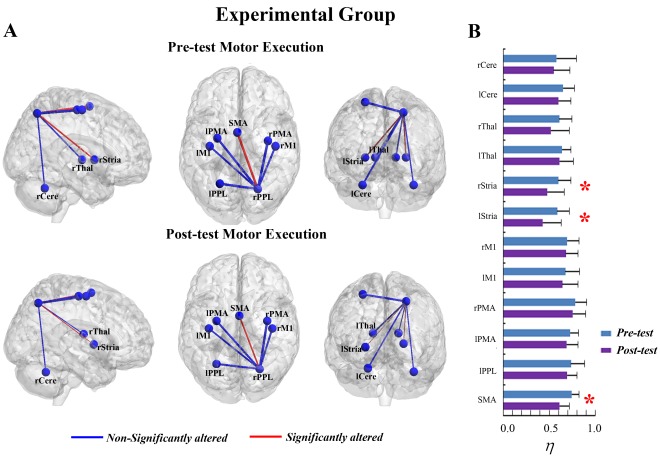
Figure 5. The interregional connectivity  between the rPPL and other ROIs of pre-tests and post-tests in the motor execution task of the experimental group.
(A) The surface visualization of all 13 ROIs with line width indicating the relative value of  . Red indicates the
  were significantly altered after motor imagery learning, while blue indicates the
  were not significantly altered after motor imagery learning. (B) The
  of pre-tests and post-tests between the rPPL and other ROIs (* represents the significant alterations, corrected p<0.05).

