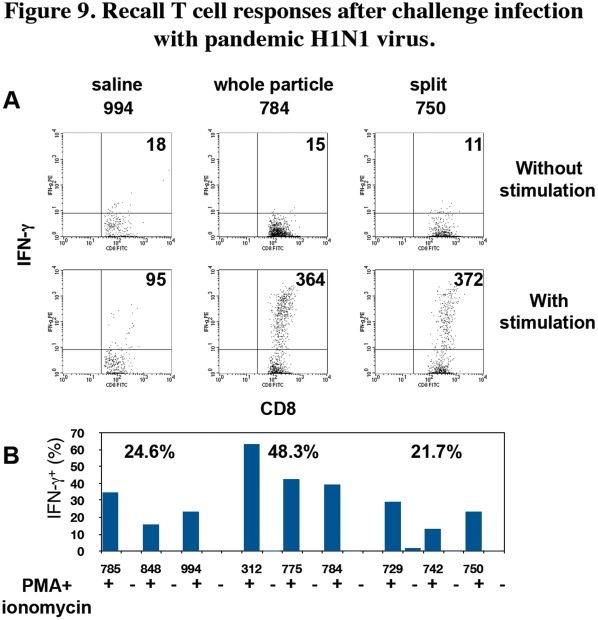
Figure 9. Recall T cell responses after challenge infection with pandemic H1N1 virus.
Cervical lymph node cells from the macaques 14 days after challenge with the pandemic H1N1 virus were cultured with NP262-270 peptide for 5 d. The recovered cells were stimulated with (+) or without (-) PMA and ionomycin for 5 h. Thereafter, intracellular IFN-γ and surface CD8 were stained. (A) Representative IFN-γ and CD8 profiles of each group are shown after gating of CD8+ cells. Upper figures: culture without PMA and ionomycin, lower figures: culture with PMA and ionomycin. Mean fluorescence intensity (MFI) of IFN-γ staining is indicated in each figure. The averages of MFI of IFN-γ+ CD8+ cells stimulated with PMA and ionomycin are 147, 395 and 285 in the saline group, the whole particle vaccine group and the split vaccine group, respectively. (B) The percentages of IFN-γ+ cells in CD8+ cells are shown. The averages of percentages of three macaques in each group are indicated in the graph. There are significant differences (P<0.05) between the saline group and whole particle vaccine group and between the whole particle vaccine group and split vaccine group.

