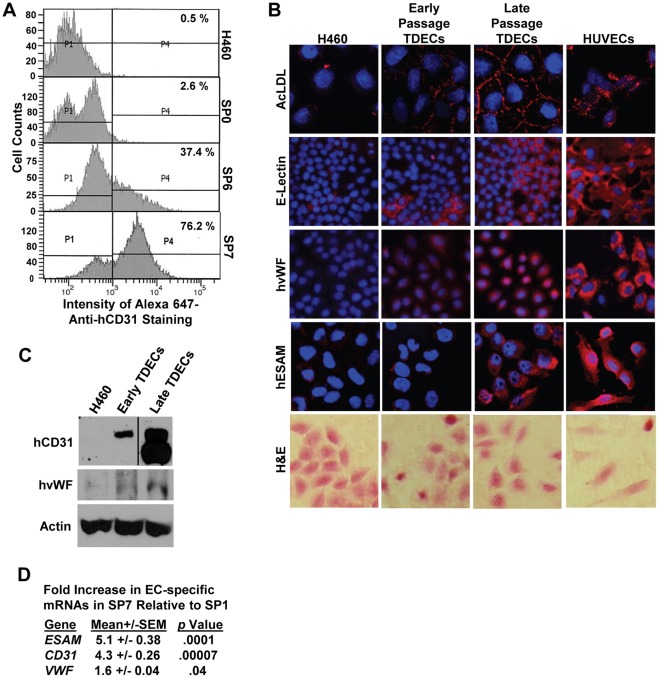
Figure 2. EC-specific marker expression increases in serially-passaged H460-derived TDECs.
(A) Cell surface staining for hCD31. TDECs from the indicated serial passages were isolated and the cell surface expression of the EC-specific marker hCD31 was then assessed by flow cytometry. (B) AcLDL uptake, E-lectin binding and anti-human vWF (hvWF) and anti-human ESAM (hESAM) immuno-staining were assessed in early and late TDECs using confocal microscopy (16). HUVECs were included as positive controls. Nuclei were stained with DAPI (blue). H&E staining under light microscopy was used to compare the morphologies of H460 tumor cells, TDECs, and HUVECs. Images were obtained at 20−40× magnification. (C) Expression of CD31 and vWF assessed by immuno-blotting. Early- and late-passage TDECs were examined by immuno-blotting for hCD31 and hvWF, as previously described [16]. All lanes in the hCD31 blot were from the same X-ray film. β-actin levels were measured on the same samples and served as a loading control. (D) qRT-PCR was used to assess mRNA expression for the EC markers ESAM, CD31, and VWF in late passage TDECs relative to early passage TDECs. Values shown represent the average of at least triplicate reactions and p values were from a standard Student’s t test.

