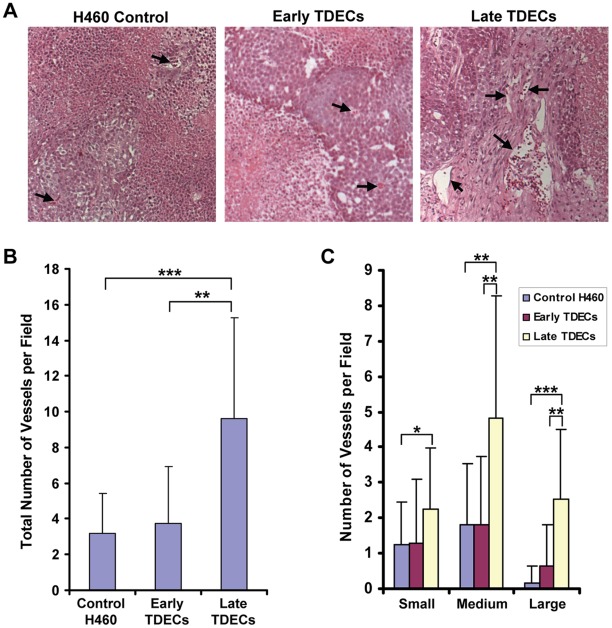
Figure 4. Tumor xenograft blood vessel density and size increase with continued serial passage of TDECs.
Tumor xenografts were established from inoculating a mix of non-GFP-tagged H460 cells (95%) and early- or late-passage TDECs (5%) into nude mice. Control tumor xenografts were similarly derived from inoculating non-GFP-tagged H460 cells and 5% GFP+ H460 cells. Paraffin-embedded sections were then prepared from the xenografts and stained with hematoxylin and eosin (A) so that tumor blood vessels could be easily identified. Typical examples of blood vessels from each xenograft type are indicated by arrows. The total number of tumor blood vessels (B), as well as the number of vessels that were small (≤25 µm), medium (25–100 µm), and large (≥100 µm) as measured by their longest dimension (C), were quantified from between 19 and 25 individual fields for each tumor type. The graphs represent the mean number of vessels per field (±SEM) and the statistical analysis was performed using a two-tailed Student’s t test (*, p<0.05; **, p<0.001; ***, p<0.0001).

