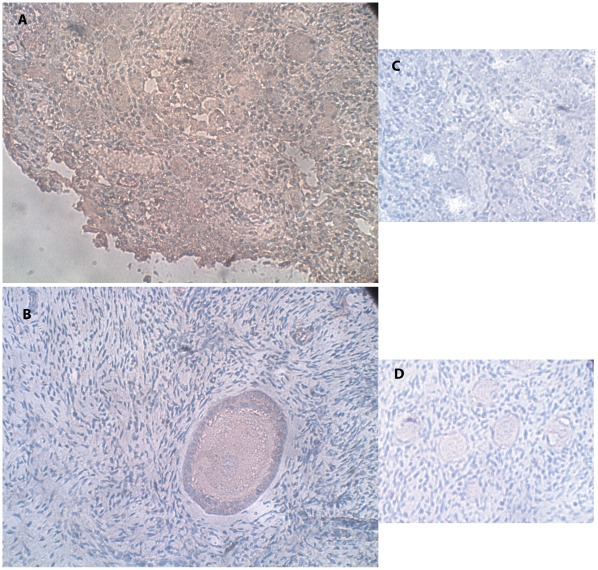
Figure 3. IMH photographs of VPAC2-R protein expression.
(A) Section of a human ovary from the same fetus as in Figure 1 (A) and (D). Note the red-brown staining indicating VPAC2-R expression in the oocytes (full weak cytoplasmic staining with nuclear staining), in a portion of the GC and stroma cells. Original magnification X400. (B) Section of human ovary from the same woman as in Figure 2 (A) and (B). Note the secondary follicle (full cytoplasmic staining with nuclear staining), with red-brown staining in the GC and stroma cells. Original magnification X400. (C) Negative control for the same ovarian section as in panel A. Note the primordial follicles with overall blue staining and lack of red-brown staining. Original magnification X400. (D) Negative control for the same ovarian section as in panel B. Note the primordial follicles with overall blue staining and lack of red-brown staining. Original magnification X400.

