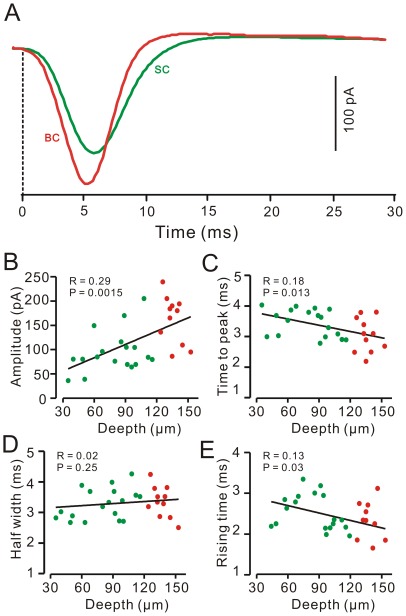
Figure 3. Relationships between properties of the evoked-EPSCs in MLIs and the depth of their somas location.
A, Representative currents traces show the air-puff stimulation-evoked EPSCs in a basket-type MLI (BC; red) and a stellate-type MLI (SC; green). The time point (0) indicates the onset of the responses. B-E, Plots show the amplitude (B), time to peak (C), half-width (D) and 10–90% rising time (E) of EPSCs versus the depth of the somas in the molecular layer, respectively. The stellate-type MLIs are indicated by green color dots, and the basket-type MLIs are indicated by red color dots. The solid lines indicate linear regression (R).

