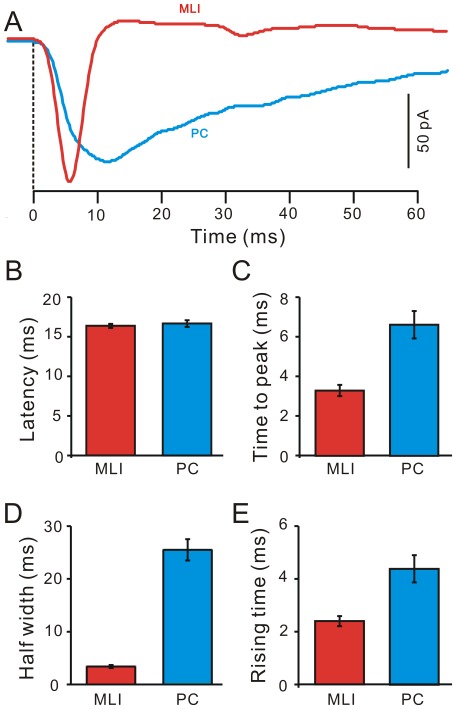
Figure 6. Properties of the air-puff stimulation-evoked EPSCs in MLIs and PCs.
A, Representative currents traces showing the air-puff stimulation-evoked EPSCs in a MLI (MLI; red) and a PC (blue). The EPSCs in the PC were evoked in the presence of SR95531 (20 µM), a GABAA selective antagonist. The time point (0) indicates the onset of the responses. B, Bar graph showing the mean amplitude of the EPSCs evoked by the air-puff stimulation in the MLIs (MLI; red; n = 10) and the PC (blue; n = 10). C, Summary of data showing the time to peak for the EPSCs in the MLIs (MLI; red; n = 10) and the PC (blue; n = 10). D, Pooled data showing the half-width of the EPSCs in the MLIs (MLI; red; n = 10) and the PC (blue; n = 10). E, Summary of data showing the 10–90% rising time of the EPSCs in the MLIs (MLI; red; n = 10) and the PC (blue; n = 10).

