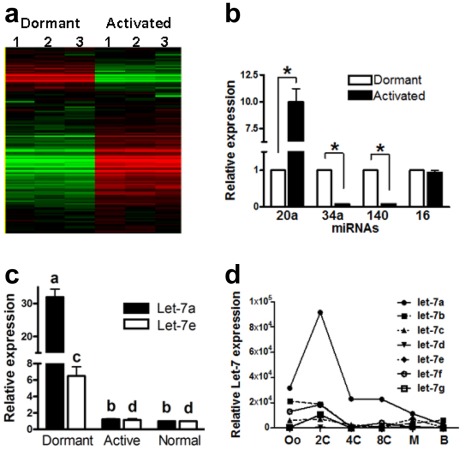
Figure 1. MicroRNA profiling of dormant and activated mouse blastocysts.
(a) Supervised hierarchical clustering of the expression of 238 miRNAs in mouse dormant and activated blastocysts. Heat map shows normalized, log-transformed relative intensities of the studied miRNA. Red, green and black color represent low, high and mean expression levels of miRNAs, respectively. Genes with similar expression patterns are grouped together. (b) Validation of expression of miR-34a, -20a, -140, and -16 by qPCR without pre-amplification. The expression patterns of these miRNAs in dormant and activated blastocyst were similar to those determined by miRNA profiling. All values are calculated against the CT values of dormant blastocysts and are presented as relative fold-change. (c) Relative expression of let-7a and let-7e in dormant, activated and normal Day 4 blastocysts as determined by qPCR without pre-amplification (a–b, c–d denote P<0.05 between corresponding groups). (d) The expression of let-7 in human embryos.

