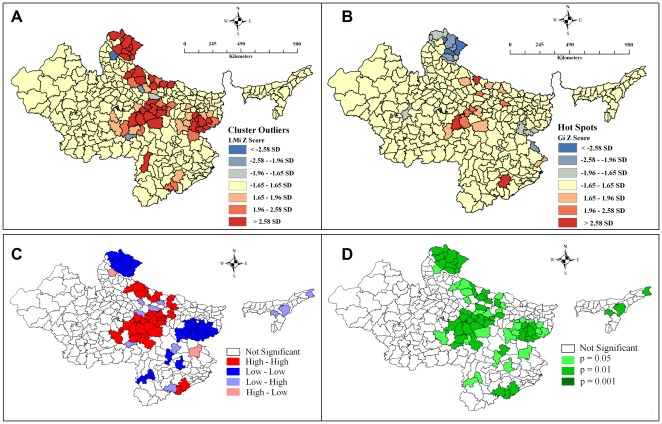
Figure 2. Maps depicting spatial clusters and outliers in under-five mortality rate across 284 districts in high focus states of India, 2010–11.
A. Cluster and Outlier analysis map (Anseline Local Moran's I = 0.45) using polygon contiguity (first order) weight in ArcGIS. B. Hot Spot analysis map (Getis–Ord Gi*) using polygon contiguity (first order) weight in ArcGIS. C. Univariate LISA Cluster map (Moran's I = 0.439) using Rook's weight in GeoDa. D. Univariate LISA Significance map of Figure C.

