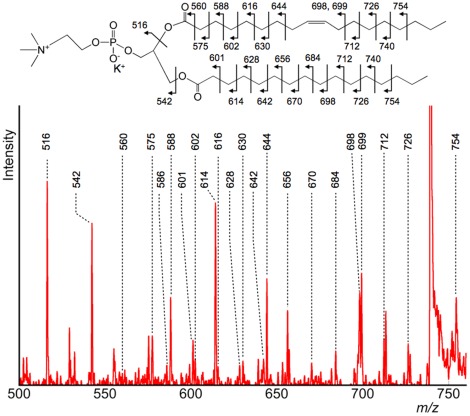
Figure 2. Detailed product ion spectrum of the m/z 500–750 region.
This product ion spectrum is an enlarged view of the m/z 500–750 region in Figure 1. These fragment ions were produced via a charge-remote fragmentation process (HE-CID specific process). The double bond position was recognized by analysing the peak pattern.

