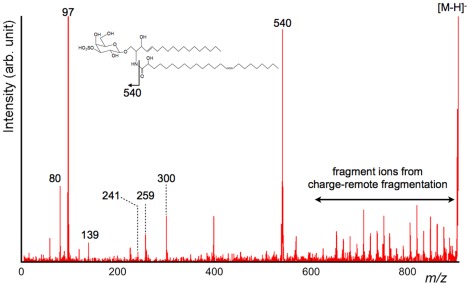
Figure 5. Detailed product ion spectrum of the m/z 560–880 region.
This product ion spectrum is an enlarged view of the m/z 560–880 region in Figure 4. From the peak pattern and the mass value of the precursor ion, m/z 888 was postulated as ST(d18∶1, C24∶1). The regular peak patterns obtained via the CRF process were largely assigned as product ions from a fatty acid moiety (C24∶1) and a long-chain base (d18∶1). Furthermore, the carbon–carbon double bond at the n−9 position was confirmed from the CRF sequencing pattern.

