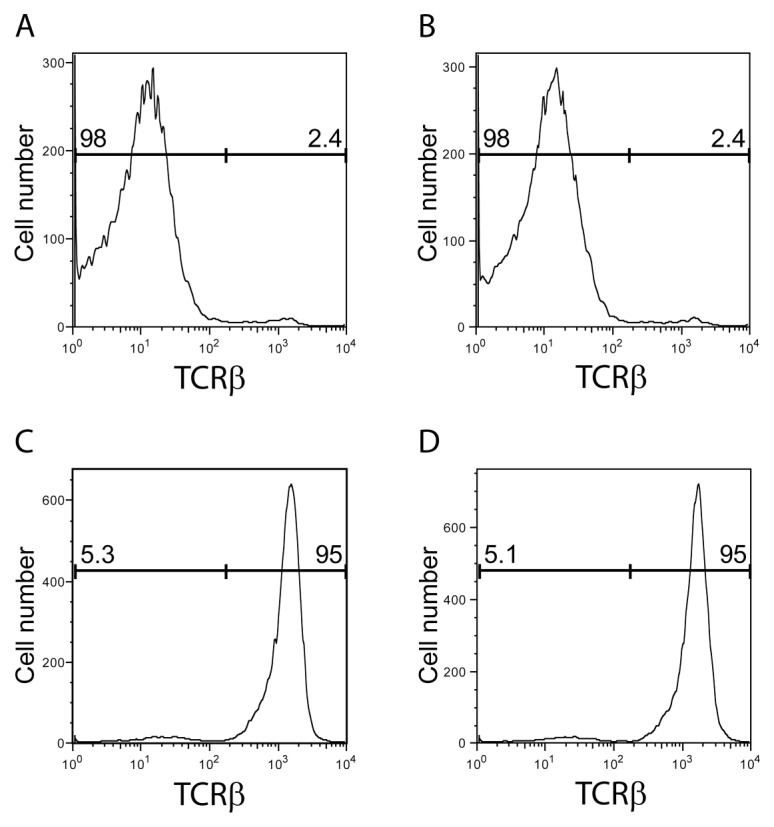
Figure 3.

Purity of isolated murine spleno-cyte fractions. Cells were stained with an anti-TCRβ antibody and analyzed by flow cytometry. T-cell–depleted splenocytes from WT (A) and α7nAChR KO mice (B) are shown. T-cell fraction from WT mice (C) and α7nAChR KO mice (D) are shown. The numbers in the graph show fractions of TCRβ−and TCRβ+ cells.
