Figure 4.
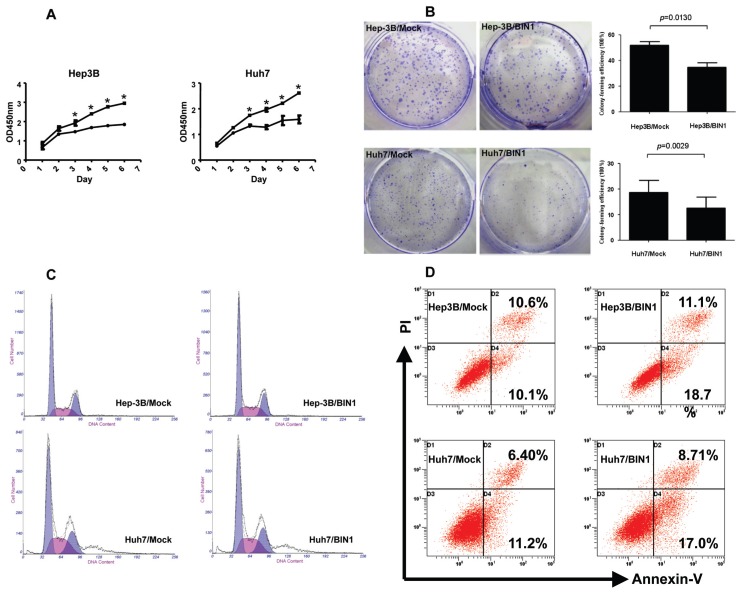
Tumor-suppressive role of BIN1 in HCC cells Hep3B and Huh7. (A) MTS assay showing the suppressive effect of BIN1 overexpression on the in vitro proliferation of HCC cell lines. Experiments were performed in triplicate. (B) Representative inhibition of colony formation in monolayer culture by BIN1. Right, quantitative analyses of foci numbers are shown as values of mean ± standard deviation. Experiments were performed in triplicate. P values were calculated using the Student t test. (C) The effect of BIN1 on cell cycle in HCC cells. The cells were transfected with BIN1 or control vector as in (A) and (B). After 48 h, the cells were collected for cell cycle distribution analysis. DNA content of BIN1 vector– or control vector–transfected cells was detected by flow cytometry. Hep-3B/Mock panel: gap 1 (G1) = 54.831, synthesis phase (S) = 23.322, gap 2 (G2) = 24.841; Hep-3B/BIN1 panel: G1 = 52.163, S = 26.885, G2 = 20.952; Huh7/Mock panel: G1 = 47.999, S = 30.405, G2 = 21.595; Huh7/BIN1 panel: G1 = 47.341, S = 29.336, G2 = 23.323. (D) Apoptosis levels of BIN1 vector– or control vector–transfected HCC cells were quantified with an annexin V and propidium iodide viability assay. The cells were transfected with BIN1 or control vector as in (A), (B) and (C). After 72 h, the cells were collected for apoptosis analysis. The percentages of annexin V– or propidium iodide–positive cells were detected by flow cytometry. Experiments were performed in triplicate. A: ●, BIN1; ■, Mock.

