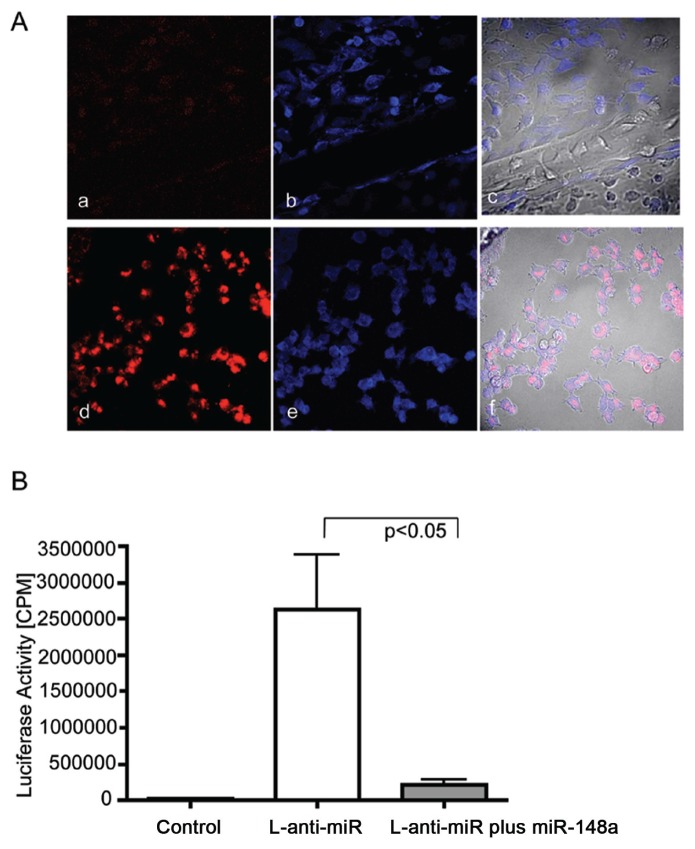
Figure 2.
Determination of miRNA transfection efficiency. (A) Determination of 48-h trans-fection efficiency by confocal microscopy. (a, b, c) Nontransfected control. (d, e, f) Cells transfected with cy3-labeled anti-miR control. (b, e) Cell bodies were labeled with TOTO-3 (blue staining). (c, f) Phase-contrast overlay with red and blue panels for detection of colocalization. The best transfection efficiency of proportional 85% was achieved at a concentration of 500 nmol/L for 48 h, visible as red staining within TOTO-3–stained cell bodies. (B) Determination of transfection efficiency by pMIR-REPORT™ luciferase system (Ambion). Graph demonstrates measured luciferase activity in cpm after 48 h transfec-tion in nontransfected (control) or MIR-REPORT™ luciferase plasmid expressing luciferase mRNA fused to the antisense sequence for hsa-mir-148a (L-anti-miR), or cotransfection of L-anti-miR with hsa-miR-148a (L-anti-miR plus miR-148a). Samples were done in triplicate, and each sample included the average of 20 cpm measurements. Data were analyzed by unpaired Student t test, and P < 0.05 was used as a criterion for significance. Error bars represent standard errors. Firefly luciferase activity was successfully inhibited within the cotransfected sample of L-anti-miR plus miR-148a (P < 0.05).

