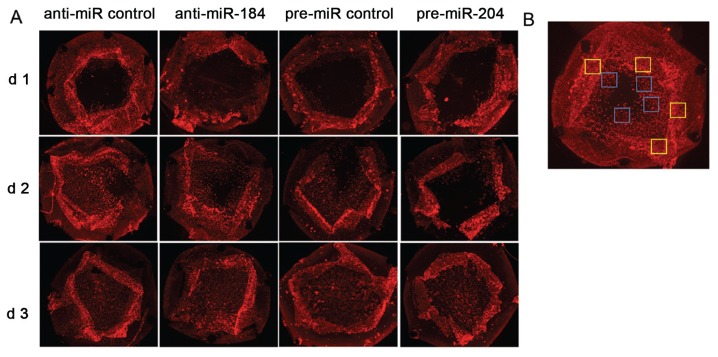
Figure 4.
Reduction of α-SMA expression after anti-miR-184 and pre-miR-204 treatment. (A) α-SMA expression within capsular bag cultures detected by immunohistochemistry after 1–3 d treatment with anti-miR-184 compared with anti-miR control and pre-miR-204 compared with pre-miR control. (B) Example image demonstrating areas for determination of IOD in Figure 5 at the capsular edge (yellow squares) and migration border (blue squares).

