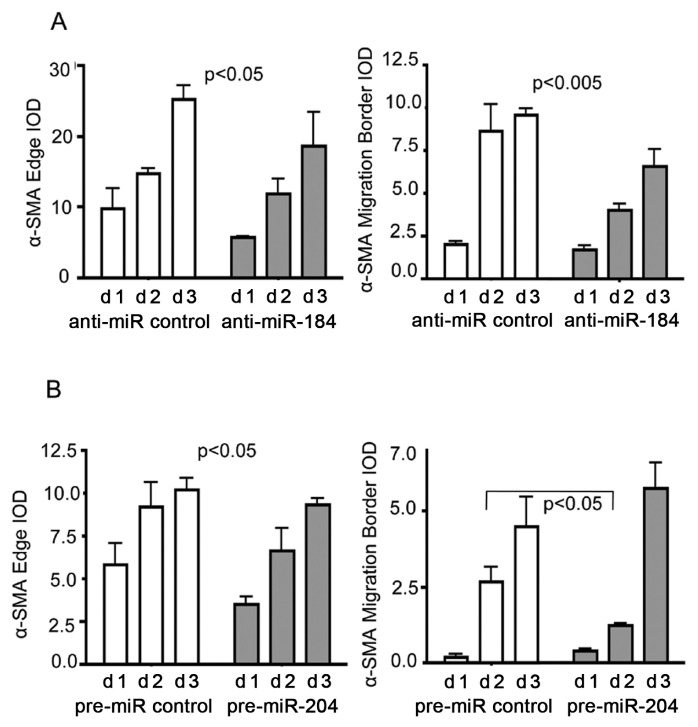
Figure 5.
Reduction of α-SMA expression after anti-miR-184 and pre-miR-204 treatment. Graph representing data analysis of α-SMA IOD derived from immunohistochemistry in Figure 4. α-SMA expression within capsular bag cultures detected by immunohistochemistry after 1–3 d treatment with anti-miR-184 compared with anti-miR control (A) and pre-miR-204 compared with pre-miR control (B). Data of anti-miRNA constructs were analyzed by two-way ANOVA by entering the standard deviation from two donor eyes with four measurements each (representing four quadrants). Error bars represent standard deviations. Data for pre-miRNA constructs were analyzed by unpaired Student t test and two-way ANOVA, by entering the standard error from three donor eyes with four measurements each (representing four quadrants). Error bars represent standard errors. P < 0.05 was used as a criterion for significance.

