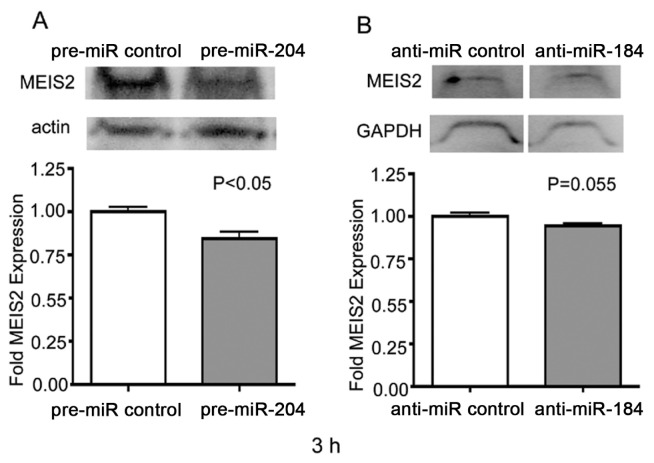
Figure 6.
Attenuation of MEIS2 expression after pre-miR-204 and anti-miR-184 treatment. Western blot analysis of MEIS2 expression within LE cells after 3 h of pre-miR control or pre-miR-204 treatment (A) or anti-miR control or anti-miR-184 treatment (B). Blots were stained with the primary polyclonal antibodies for MEIS2 as well as β-actin or GAPDH (loading control). Graphs represent Image Gage 4.1 densitometric analysis of MEIS2 expression ratio in the upper panel. Three samples per group with four lenses per sample were analyzed. Intensities of MEIS2 were normalized to the β-actin or GAPDH loading controls through division. For comparison of controls versus miRNA treatments, a two-tailed unpaired Student t test was used. Error bars represent standard errors. P < 0.05 was used as a criterion for significance.

