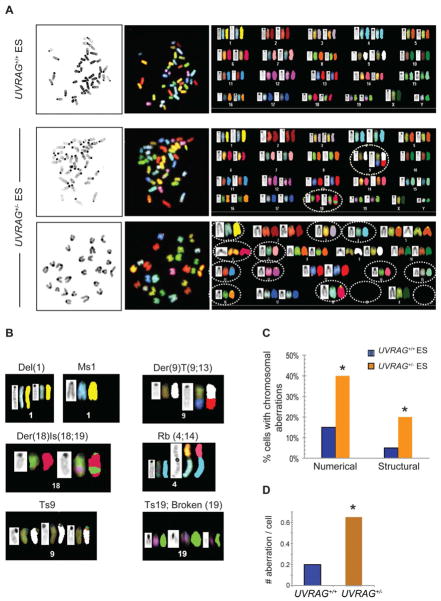
Figure 7. UVRAG Is Required for Chromosome Stability.
(A) Spectral karyotyping (SKY) analysis of UVRAG+/− (1st row) and UVRAG+/− (2nd and 3rd rows) mouse ES cells. Each representative metaphase spread is shown with DAPI-stained chromosomes (left panel), spectral-based display (middle panel), and the corresponding karyotype table (right panel) depicting individual chromosome in DAPI staining (left), spectral-based color (center) and classified color (right). The chromosomes are arranged in numerical order from left to right and top to bottom. UVRAG+/+ cells show normal diploid SKY karyotype (1st row). Structural (2nd row; 40XY, Der(9)T(9;13), Der(18)Is(18;19)) and numerical (3rd row; 26X, (-Y, -1, -3, -4, -6, -7, -11, -12, -14, -15, -16, -18, -19, -19)) chromosomal abnormalities were observed in UVRAG+/− ES cells and denoted by dotted lines.
(B) Representative examples of chromosomal abnormalities in UVRAG+/− ES cells. The DAPI-banded (left), display colors-banded (middle), and the spectrally classified chromosomes (right) are shown. Del, Deletion; Der, Derivative Chromosome; T, Translocation; Rb, Robertsonian translocation; Is, Insertion; Ms, Monosomy; Ts, Trisomy.
(C–D) Quantification of chromosomal aberrations in UVRAG+/+ and UVRAG+/− ES cells. Frequencies of structural and numerical aberrations (C) and the average events of chromosomal aberrations per cell (D) were determined from 20–40 metaphase spreads (pooled from two independent experiments) of UVRAG+/+ and UVRAG+/− ES cells. *, P <0.05, Wilcoxon Signed-rank Test. See also Figure S6.

