
Figure 1.
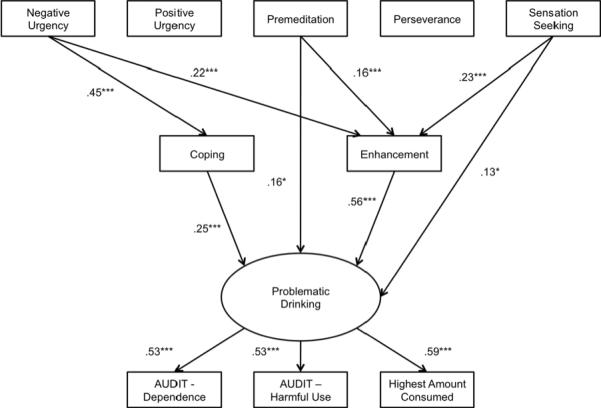
Results of the structural model. Only significant standardized effects at p < .05 are shown. Proportion of variance accounted for by the model (R2) in the outcome variables: coping motives = .20, enhancement motives = .18, problematic drinking = .67, highest amount of alcohol consumed = .35, AUDIT harmful use = .35, AUDIT dependence = .28. *** p < .001.