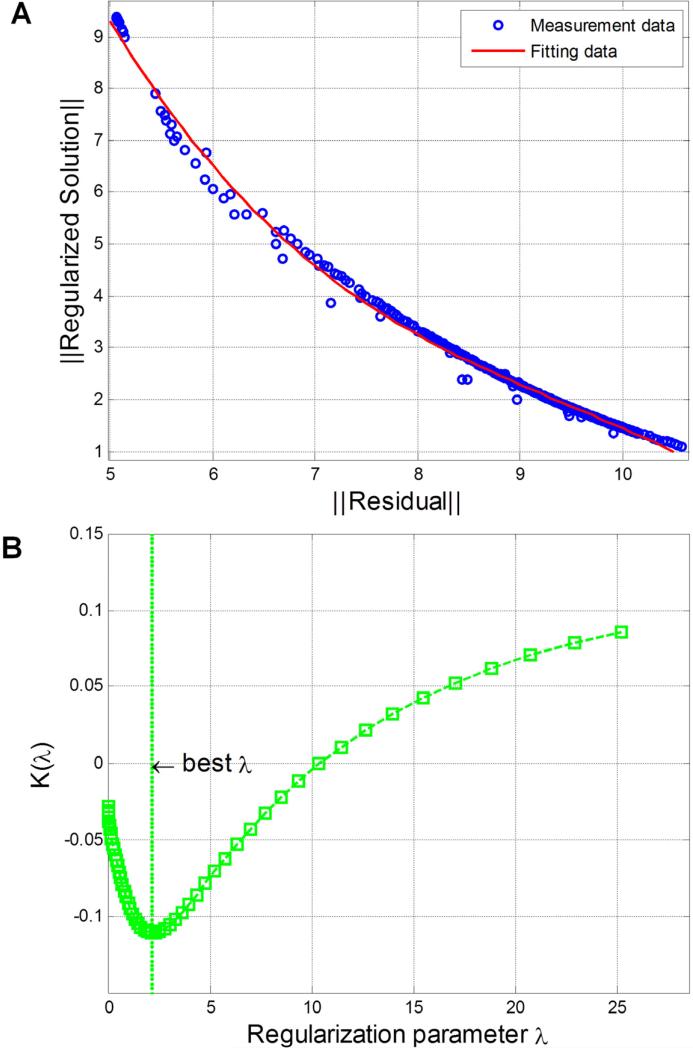
Fig. 2.
Optimal regularization parameter chosen from L-curve analysis. (A) L-curve from experimental reconstructions is used to balance the size of residual (2-norm of Ax′ – b) and size of regularized solution (2-norm of x′). A is the whole Jacobian matrix computed based on a MC forward model; x′ is reconstructed fluorescence distribution; b is obtained from the fluorescence measurement. (B) Curvature of L-curve [22] with respect to regularization parameters is used to choose the best regularization parameter.

