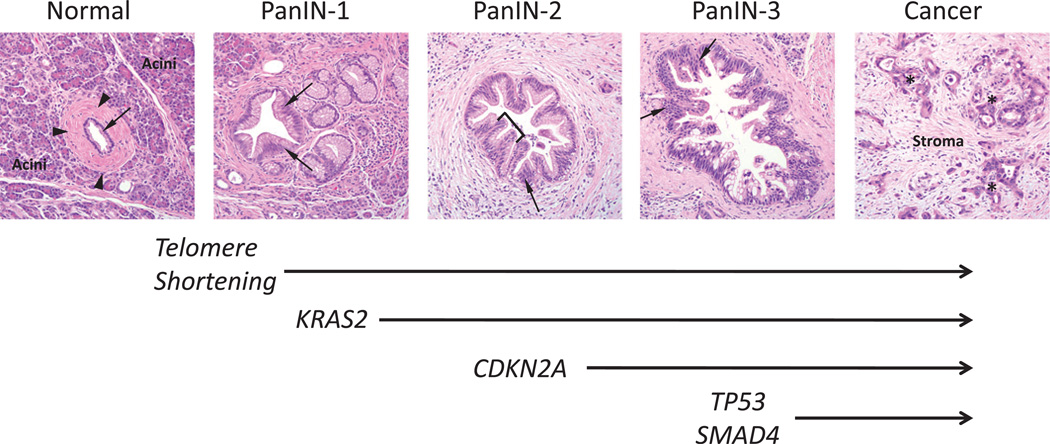
Figure 1.
Morphological and genetic progression model of pancreatic carcinogenesis. Histological examples of a normal pancreatic duct, pancreatic intraepithelial neoplasia (PanIN) and pancreatic cancer are shown. Normal ducts are characterised by a low cuboidal epithelium (arrow) surrounded by a periductal fibrotic cuff (arrowheads). Ductal epithelium is relatively sparse compared with the surrounding acinar component. PanIN-1 lesions are differentiated from normal ductal epithelium by the presence of mucinous hyperplasia of the ductal cells (arrows) but without cytological atypia. By contrast, PanIN-2 lesions are notable for the presence of nuclear enlargement, atypia, crowding (arrow) and papillary infoldings of the epithelium (brackets). PanIN-3 lesions, synonymous to high-grade dysplasia/carcinoma in situ, show a complete loss of cell polarity (arrows) and marked cytological atypia in association with frequent mitotic figures and pseudopapillary growth of the neoplastic epithelium. PanIN-3 lesions may progress to invasive cancer, characterised by poorly formed neoplastic glands (asterisk) with an infiltrative growth pattern. Note the abundant desmoplastic stroma that is also a common feature of pancreatic cancer. Based on this progression model, the molecular alterations that accumulate during pancreatic carcinogenesis can be classified into early (telomere shortening and activating mutations in KRAS2), intermediate (inactivating mutations or epigenetic silencing of p16/CDKN2A) and late (inactivating mutations of TP53 and SMAD4) events. Mutations in additional genes may also occur during PanIN formation but are not illustrated in this example.

