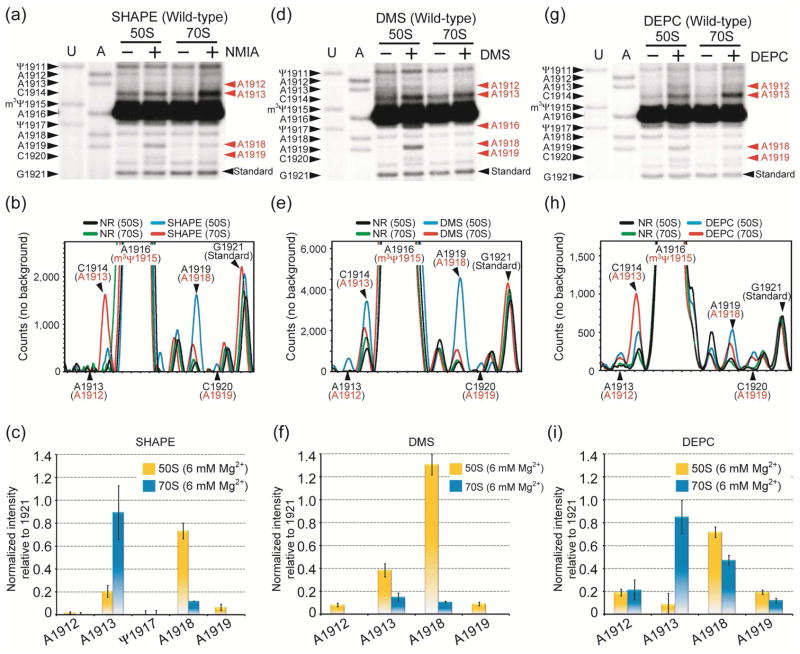
Figure 2.
Autoradiograms (top) and quantification (center, bottom) of SHAPE (a, b, c), DMS (d, e, f), and DEPC (g, h, i) probing analyses on wild-type 50S subunits and 70S ribosomes are shown. In panels a, d, and g, the E. coli H69 sequence corresponding to the dideoxy nucleotide stop sites (U and A reactions) is on the left side, and chemical modification sites, which cause a primer extension stop at the 3′ nucleotide, are in red on the right side. The normalized intensities for modified sites were calculated by subtracting non-specific primer extension stops (black and green traces, panels b, e, and h) from total intensity (blue and red, panels b, e, and h), and then normalizing to a uniform band (position 1921) (panels c, f, and i). The actual stop sites are indicated in black and the chemical modification sites are shown in red (panels b, e, and h).

