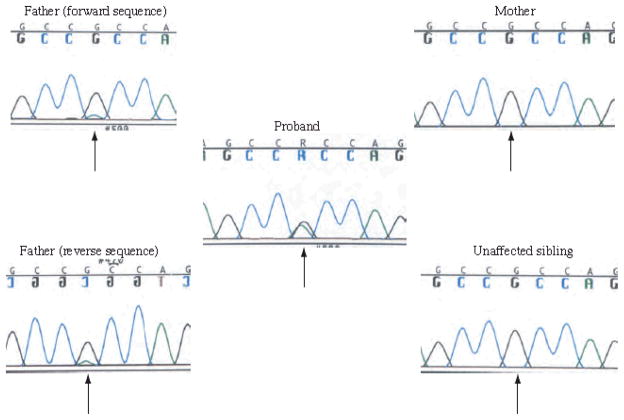
Figure 2.
Family XI chromatograms. The proband’s chromatogram is in the center demonstrating heterozygosity for the p.R496H mutation. The unaffected mother and sibling are depicted on the right with normal sequences (homozygous for the “G”). The unaffected father’s forward and reverse sequence are depicted on the left, in both cases demonstrating a small sub “A” peak beneath the normal “G” peak at this base position, indicating a low level mosaicism for the p.R496H mutation. Arrows indicate the base in which the p.R496H mutation occurs.

