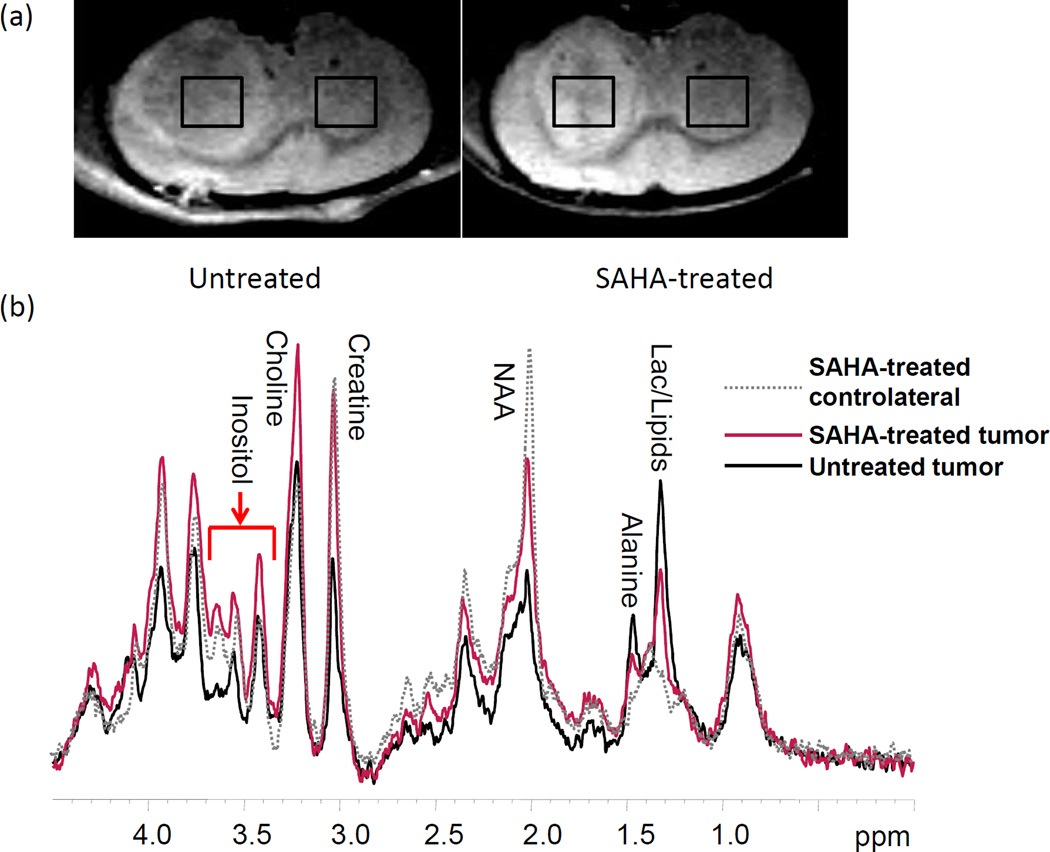
Figure 1.
(a) T2-weighted images of untreated (Left) and SAHA-treated (Right) rats, on which representative regions of interesting used for MR spectroscopy are shown (TR/TE=2500/45 ms). (b) In vivo 1H MRS (STEAM) obtained from the tumor side with (red) and without (black) SAHA treatment. The grey dotted line was that obtained from SAHA-treated contralateral side (non-tumor side).

