
Fig. 2.
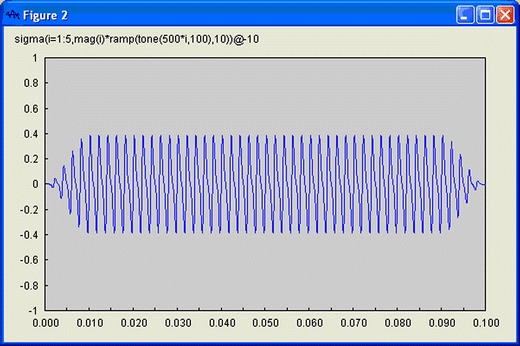
Signal displayed in AUX Viewer. The x-axis is specified in seconds. The spectrum of the signal (not shown) can be seen by pressing the F4 key in this window
Official websites use .gov
A
.gov website belongs to an official
government organization in the United States.
Secure .gov websites use HTTPS
A lock (
) or https:// means you've safely
connected to the .gov website. Share sensitive
information only on official, secure websites.
Signal displayed in AUX Viewer. The x-axis is specified in seconds. The spectrum of the signal (not shown) can be seen by pressing the F4 key in this window