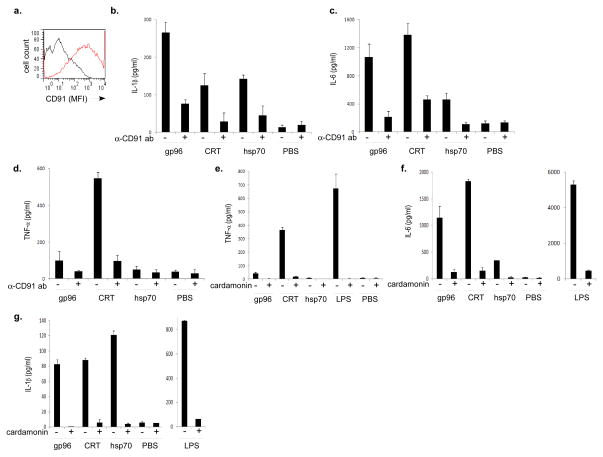
Figure 3. HSP-CD91 interactions provide distinct cytokine profiles.
a. Peritoneal exudate cells obtained from C57BL/6 mice were stained with rabbit anti-CD91 antibody (red) or control IgG (black) and then with the FITC-labeled secondary antibody. PECs obtained from C57BL/6 mice were incubated for 20 hr with gp96, CRT or hsp70 or PBS. Incubations were done in the presence (+) or absence (-) of anti-CD91 antibody. Supernatants were harvested and assayed by ELISA for; b. IL-1β, c. IL-6 or d. TNF-α. PECs obtained from C57BL/6 mice were incubated for 20 hr with gp96, CRT or hsp70 or 1EU LPS or PBS. Incubations were done in the presence (+) or absence (−) of 10 μM of the NF-κB inhibitor Cardamonin. Supernatants were harvested and assayed by ELISA for e. TNF-α, f. IL-6 or g. IL-1β. Error bars in b–g. represent standard deviation of triplicates. Figure represents one of at least 2 a or 3 b–g independent experiments with similar results.

