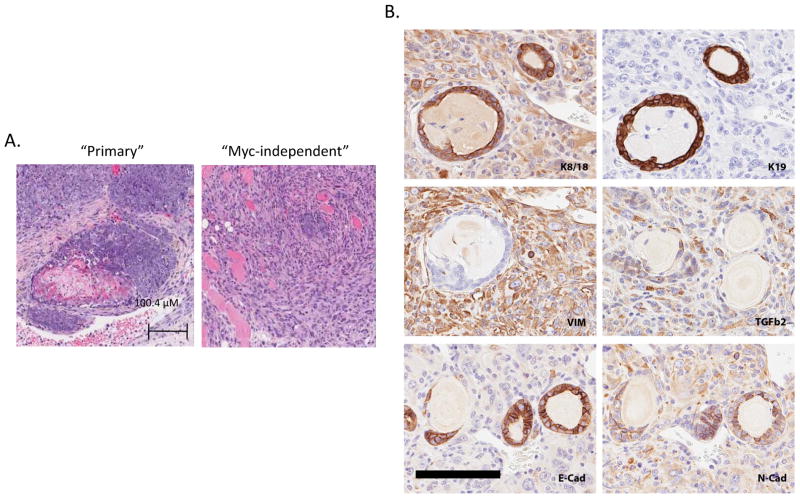
Figure 4. Analysis of pathway activity in the MTB/TOM mammary tumors.
A. Heat maps showing TGFβ, TNFα, and Ras pathway activity in primary and Myc-independent MTB/TOM mouse mammary tumors. Numerical values for predicted pathway probabilities with upper and lower limits for all pathway predictions and training data are provided in the Supplementary Tables. B. Immunohistochemical staining to confirm activation of TNFalpha, and TGFbeta. C. Graph showing correlation between predicted pathway probabilities of Ras vs. TGFbeta; TNFalpha vs. TGFbeta; and Ras vs TNFalpha.

