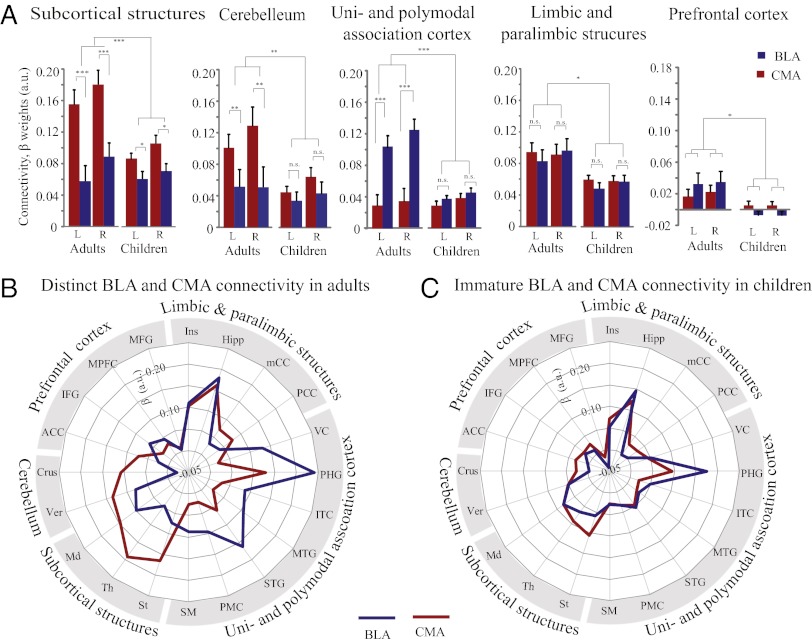
Fig. 4.
Differential patterns of BLA and CMA functional connectivity in adults and children. (A) Parameter estimates represent the strength of functional connectivity between the BLA (shown in blue) and CMA (shown in red) with five target networks of interest – subcortical structures, cerebellum, uni- and polymodal association cortex, limbic and paralimbic structures, and prefrontal cortex. (B and C) Schematic polar plots illustrating weaker integration and differentiation of BLA and CMA connectivity in children compared to adults. (B) In adults, the BLA has stronger functional connectivity with unimodal and polymodal association cortex, whereas the CMA showed stronger functional connectivity with subcortical structures and cerebellum. (C) In children, these differential patterns are significantly less pronounced. See SI Appendix, Fig. S6 for abbreviations and additional details on anatomically-defined target networks and replication in the second cohort of children. n.s., not significant; *P < 0.05; **P < 0.01; ***P < 0.001.

