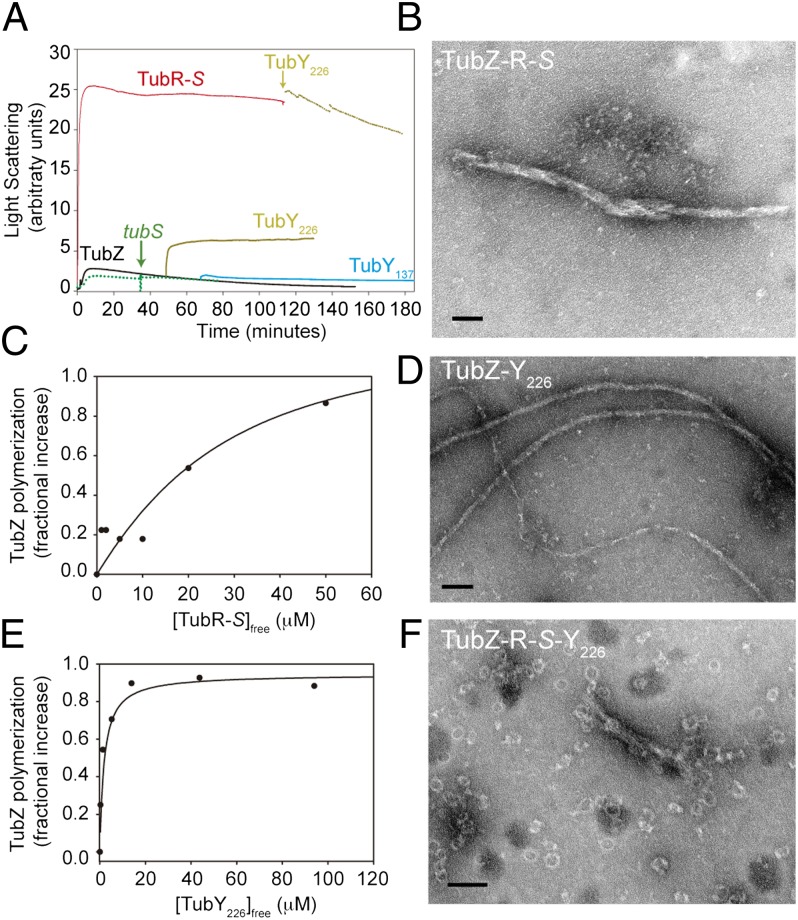
Fig. 4.
TubR and TubY interaction with TubZ filaments. (A) TubZ (10 μM) polymerization monitored by 90° light scattering (black) shows the effect of the partners’ addition during assembly. Additions are 10 μM TubR-5 μM tubS complex (red), 10 μM TubY226 (yellow), 10 μM TubY137 (blue), and 5 μM tubS (dotted green line). (B) Electron micrograph of TubZ bundles induced by interaction with TubR-S. (C) Titration by sedimentation of the increase in TubZ polymerization vs. TubR–tubS complex concentration. The solid line is a model fit for approximately 1:1 binding with Kd = 39 μM. (D) TubZ filaments in the presence of TubY226. (E) Titrations by sedimentation of the increase in TubZ polymerization vs. TubY226 concentration; the line is a model fit with 1:1 binding (n = 1) and Kd = 0.9 μM. Models with n < 1 were equally compatible with the data, whereas models with n > 1 strongly deviated from the data. (F) Reshaping of the TubZ-R-S complex bundles into rings when TubY226 is added. (Scale bars: 100 nm.)

