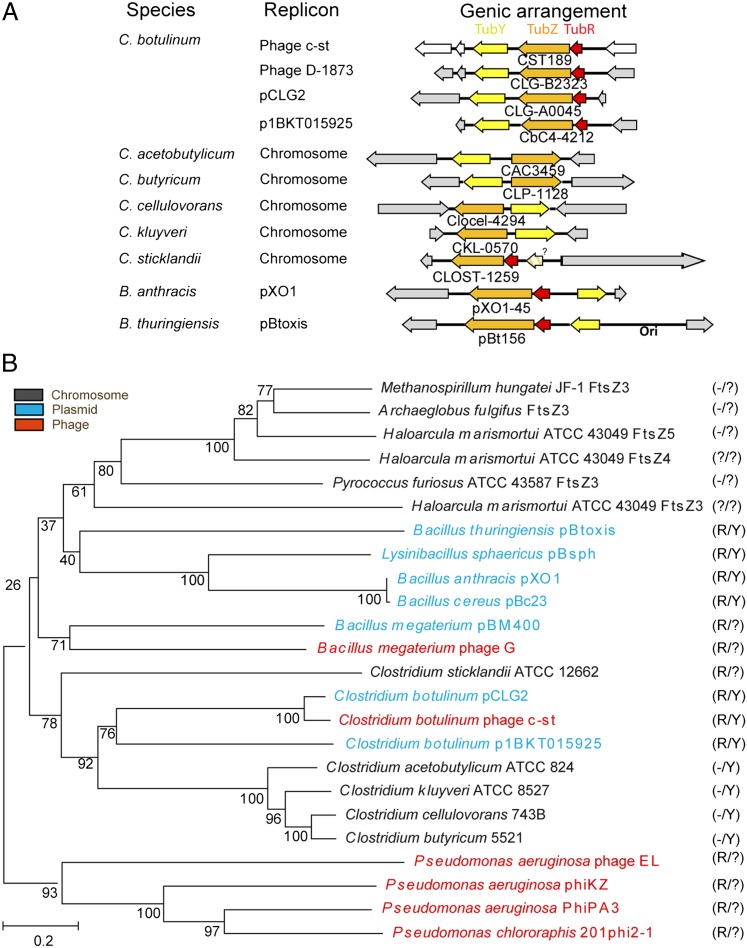
Fig. 5.
Gene organization and evolution of TubZ-based segrosomes. (A) Comparative schematic diagram of the type III segregation system cluster in different replicons from Clostridium and two Bacillus species. The positions of the genes tubZ (orange), tubR (red), and the unique component described here tubY (yellow) are shown. (B) Phylogenetic tree of TubZ shows relationships between phage (red), plasmid (blue), and chromosomal (gray) tubZ sequences. Bootstrap values representing confidence levels are indicated for selected branches. (Right) Presence or absence of tubR (R) and tubY (Y) near tubZ is shown. Question marks indicate the presence of putative proteins that share with TubR only an HTH-motif and a small size or include only long coiled-coil motifs like TubY.

