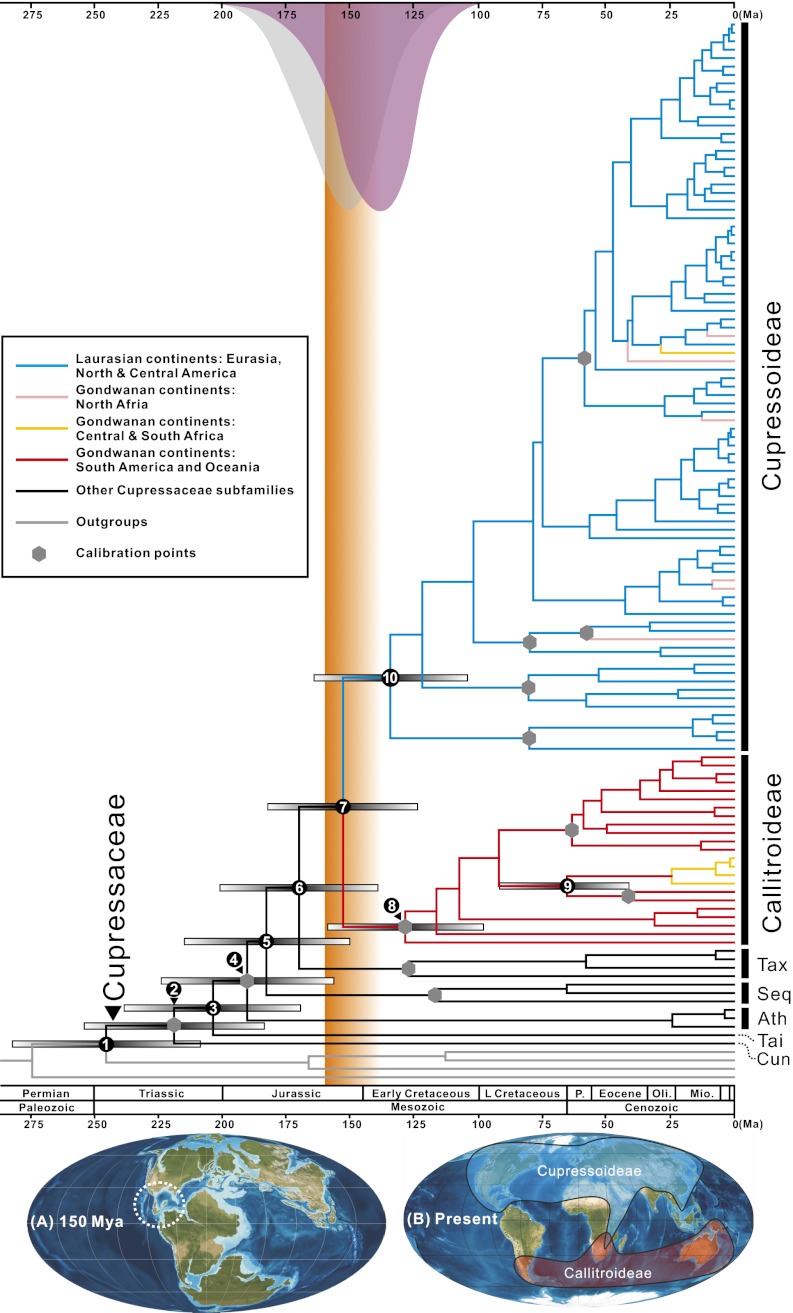
Fig. 1.
(Upper) Chronogram for 122 Cupressaceae species and 22 outgroups based on an alignment of >7,000 nucleotides of plastid DNA (144-taxon dataset). A geological time scale is shown at the bottom (48). Blue lines represent Cupressoideae restricted to the area of Laurasian continents. Red lines represent Callitroideae restricted to Gondwanan continents. Pink lines represent species occurring in Africa in and north of the Sahara. Yellow lines represent species occurring in Africa south of the Sahara. Gray hexagons represent calibration points. Gray bars represent 95% HPD intervals for nodes 1–10. Gray (run 1) and purple (run 7) normal distributions represent the posterior for the BEAST age estimate of node 7 when uniform or lognormal priors were applied to calibration points. Orange shading indicates the period of decreasing feasibility of floristic exchange between Laurasia and Gondwana. Divergence times of nodes 5, 6, 7, 8, and 10 overlap with the fragmentation of Pangea. (Lower) Maps show (A) a paleocontinent reconstruction at 150 Ma and (B) the current distribution of Callitroideae and Cupressoideae. The stippled circle in A emphasizes island chains between North and South America; Ath, Athrotaxidoideae; Cun, Cunninghamioideae; Seq, Sequoioideae; Tai, Taiwanioideae; Tax, Taxodioideae. Reprinted with permission from Ron Blakey, Colorado Plateau Geosystems.

