
Fig. 2.

Thermodynamics of the Aβ42 dimerization process. (A) Total protein internal energy  , (B) solvation free energy Δμtot, and (C) solvation enthalpy Δhtot and solvation entropy -TΔstot for dimer conformation along the simulation trajectory. In these and the following panels, the initial values are set to zero, and vertical dashed lines refer to 32 and 47 ns indicating the approach stage (32 to 47 ns, colored by light yellow) and the structural adjustment stage (47 to 100 ns, colored by light orange). By combining
  and Δμtot, we obtain a free energy
  shown in D whose average over protein conformations yields the Gibbs free energy up to the protein configurational entropy (35). Its enthalpy component (
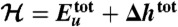 ) and entropy component (
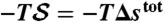 ) are presented in E and F, respectively. (Because the protein configurational entropy is not taken into account in
  , its entropy component is solely given by the solvation entropy.) Red horizontal bars in D–F represent averages over each 5-ns time interval.