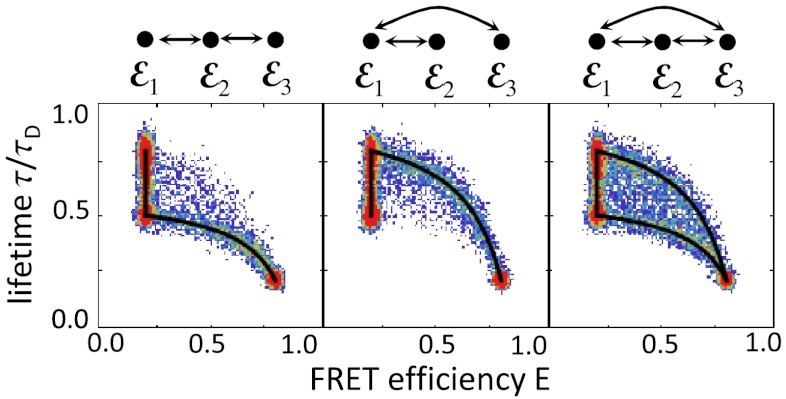
Fig. 3.
The influence of donor quenching on the FRET efficiency and lifetime density histogram shown in Fig. 2B. The FRET efficiencies of the states are ε1 = 0.2, ε2 = 0.2, ε3 = 0.8 and corresponding relative lifetimes 0.8, 0.5, and 0.2. All other parameters are the same except the total count rate in the second state is reduced because of quenching, nA2 + nD2 = 62.5 ms-1.

