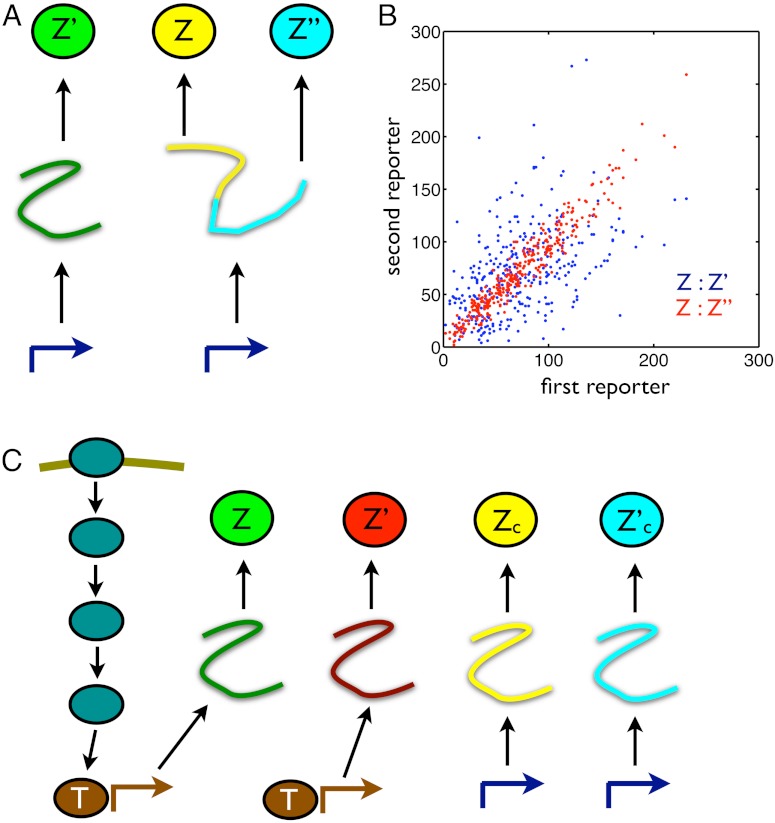
Fig. 2.
Designs of conjugate reporters to measure the effects of different cellular subsystems on variation in output. (A) To distinguish transcriptional from translational effects, three reporters are needed including a bicistronic mRNA with two independent ribosome binding sites. (B) Simulated results for the reporters in A assuming that extrinsic fluctuations affect only the rate of transcription, which fluctuates between three different levels (reactions and parameter values are given in SI Text). Blue dots show Z plotted against Z′: The average spread along the Z = Z′ diagonal equals the sum of V[Z] and the extrinsic variance; the average spread perpendicular to the diagonal equals the sum of the transcriptional and translational variation (SI Text). Red dots show Z plotted against Z′′: the average spread along the diagonal equals the sum of V[Z], extrinsic, and transcriptional variation; the average spread perpendicular to the diagonal equals translational variation. For the parameters chosen (SI Text), the translational noise (coefficient of variation) is 0.12; the transcriptional noise is 0.39; and the extrinsic noise is 0.41. These numbers agree with Eqs. 9 through 11 to two decimal places. (C) Four reporters are needed to distinguish transductional variation from variation generated by gene expression. Here, a signaling network activates a transcription factor, T, in response to extracellular inputs. To measure variation in the output Z arising from gene expression, we require two conjugate reporters, Z and Z′, whose expression is controlled by this transcription factor. To find a bound on transductional variation, we use two further conjugate and constitutively expressed reporters, Zc and  .
.

