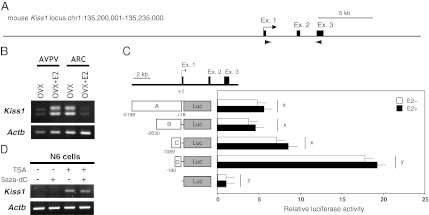
Fig. 1.

Characterization of the Kiss1 gene expressed in the mouse AVPV and ARC. (A) Schematic illustration of the genomic structure around the mouse Kiss1 gene. Filled boxes and arrowheads show exons and primer regions, respectively, used in RT-PCR analyses. (B) Expression pattern of Kiss1 mRNA. RT-PCR analysis of Kiss1 expression in the AVPV and ARC is shown. RT-PCR analysis of AVPV and ARC tissues showed the same positive bands in both brain regions. (C) Identification of the core promoter region of Kiss1 expression in the hypothalamus. (Upper) A map of the Kiss1 locus. (Lower) Empty plasmid (pGL4-mock) or constructs carrying different lengths of the Kiss1 5′-flanking regions (labeled A–D) were transfected into immortalized hypothalamic N7 cells, together with pcDNA-ERα plasmids. Luciferase activities were determined relative to that of pGL4-mock. Open and filled bars indicate the absence and presence of E2 treatment, respectively. Each bar represents the mean of triplicate experiments ± SEM. x, y, z, significantly different from each other (P < 0.01). (D) Effects of inhibitors of histone deacetylation and/or DNA methylation on Kiss1 expression in the immortalized hypothalamic cell line. RT-PCR analysis of Kiss1 gene expression in N6 cells treated with 200 nM of TSA (an inhibitor of histone deacetylation) and/or 1 μM of 5-aza-dC (an inhibitor of DNA methylation). Total RNA (1 μg) extracted from cells was used for RT-PCR analyses.
