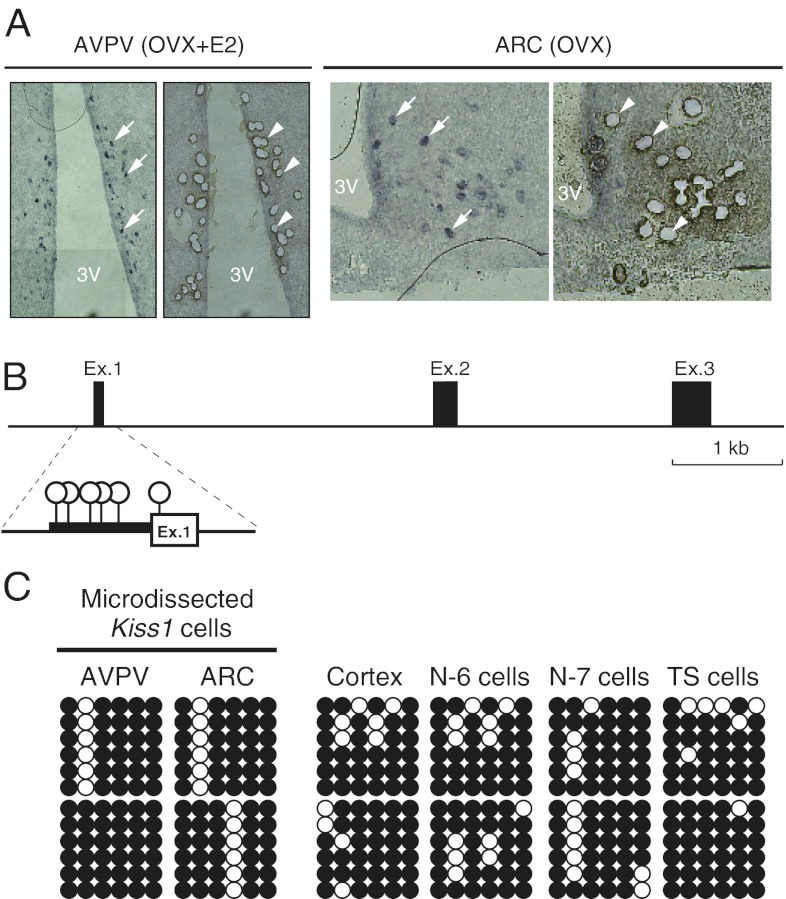
Fig. 3.
DNA methylation status of the Kiss1 promoter region in Kiss1-expressing or -nonexpressing cells. (A) Images of sections including AVPV or ARC nuclei before (Left in AVPV and ARC) and after (Right in AVPV and ARC) laser microdissection. Kiss1 neurons were visualized by in situ hybridization and were isolated based on in situ hybridization signals (indicated by arrows in left panels and by arrowheads in right panels). Kiss1-positive cells were collected from the AVPV in OVX+E2 mice and from the ARC in OVX mice. 3V, third ventricle. (B) Six CpG sites in the Kiss1 core promoter region analyzed by bisulfite sequencing. Open circles indicate CpG sites. (C) DNA methylation status of individual CpGs at the Kiss1 core promoter region in each sample. Bisulfite sequencing analysis was performed with DNA extracted from each sample. Each row of circles represents a single clone randomly picked from each of two independent PCRs. Open and filled circles represent unmethylated and methylated cytosines, respectively. TS cells, trophoblast stem cells.

