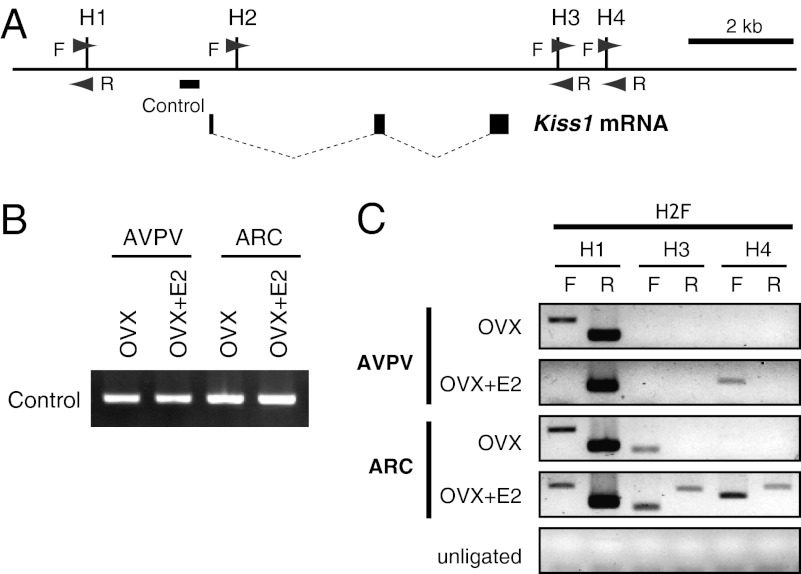
Fig. 4.
Chromatin conformational change at the Kiss1 gene locus in the AVPV and ARC. (A) Diagram of the Kiss1 locus; filled boxes indicate exons, and thin dotted lines indicate introns. HindIII restriction endonuclease sites are indicated by vertical lines (labeled by H1–H4). Arrowheads show positions of primers used in 3C assays. The thick horizontal bar indicates the region used in loading control PCR. (B) PCR for loading control. OVX mice with (OVX+E2) or without (OVX) E2 treatment were subjected to AVPV and ARC tissue sampling. (C) 3C analysis of the Kiss1 locus obtained from AVPV and ARC tissues in the absence and presence of E2 stimulation. 3C assays were performed, and PCR products were analyzed by agarose gel electrophoresis. PCR products were generated using primer H2 forward (H2F) in combination with one of the other HindIII primers (H1–H4) as indicated.

