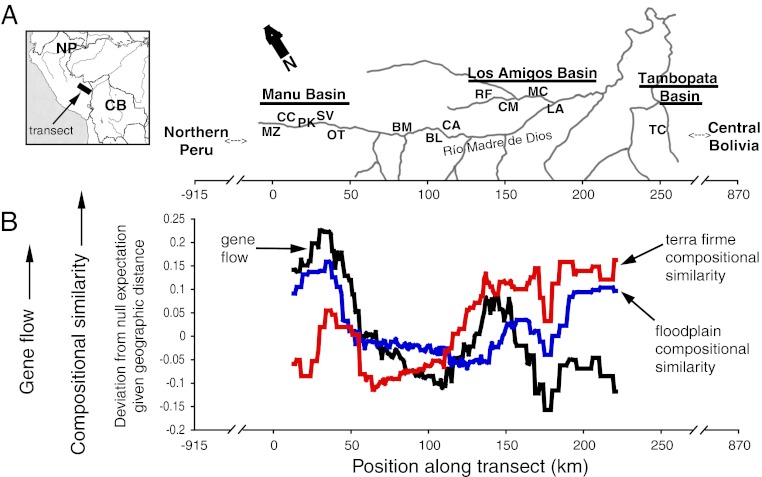
Fig. 2.
(A) Map of transect in southern Amazonian Peru with locations of community surveys and population genetic sampling. (B) Variation in compositional similarity (Sorensen index) and average plastid gene flow (1 − Fst) between communities along the transect. Values shown represent deviation from expected values given the geographic distance between sampling points. A sliding-window approach was taken, in which values were averaged over 26-km intervals (SI Materials and Methods).

