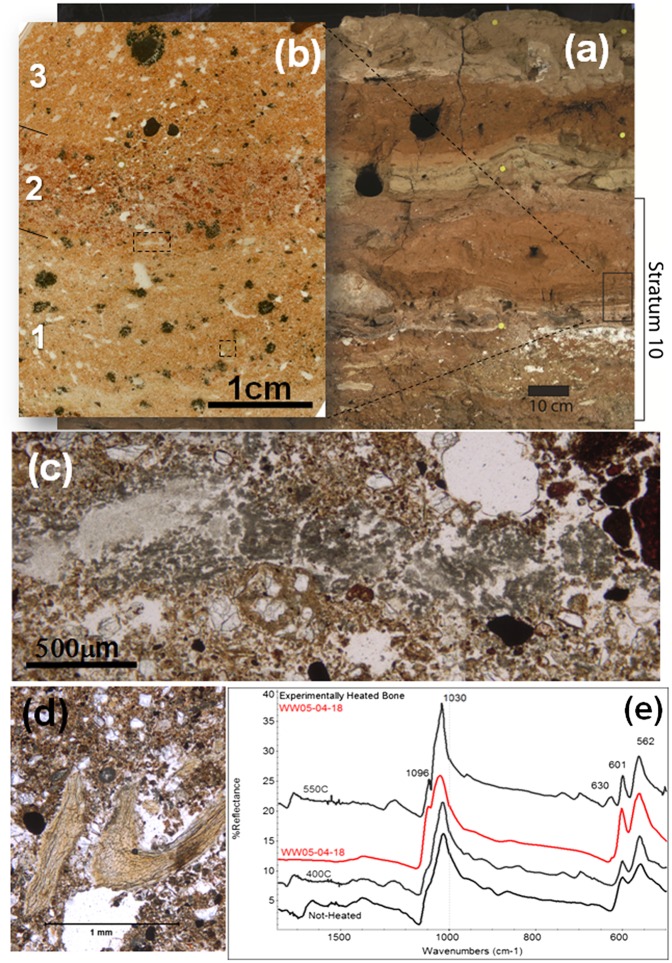
Fig. P1.
(A) Photograph of profile in square Q28. Box indicates approximate location of thin section shown in B, exhibiting three microfacies: 1, bottom sand silt and clay mixed with ashed plant material, dispersed wood ash, and bone fragments; 2, clay aggregates and fragments; and 3, rounded aggregates of sandy silt. Boxes mark the location of the microphotographs shown in C and D. (C) Clump of calcitic wood ash with typical ash rhombs and prisms at the contact between microfacies 1 and 2. (D) Bone fragment from microfacies 1 in B. (E) Fourier transform IR reflectance spectra of bone fragment shown in micrograph (D, red line) and of unheated and experimentally heated bone processed in thin section (black lines). Appearance of infrared bands at 1,096 cm−1 and 630 cm−1 are used as heating temperature indicators, showing that the fragment was most probably heated to more than 400 °C.

