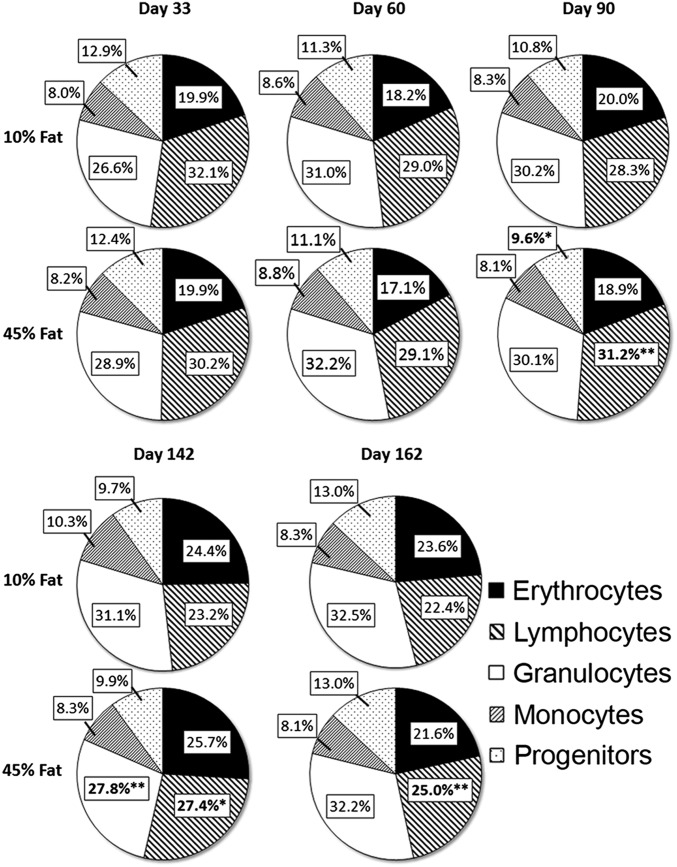
Fig. 2.
Distribution of bone marrow hematopoietic cell subpopulations in mice fed 10% or 45% fat diet. Bone marrow cells were labeled with anti-CD31 (clone ER-MP12) and anti–Ly-6C (clone ER-MP20), with cell subpopulations determined as described in Fig. S2, including specific markers to confirm the identity and size of each marrow subpopulation. Data show the percent of total nucleated marrow cells for each cell type at various times after the start of diet. n = 7–8 mice per group. *P < 0.05, **P < 0.01.

