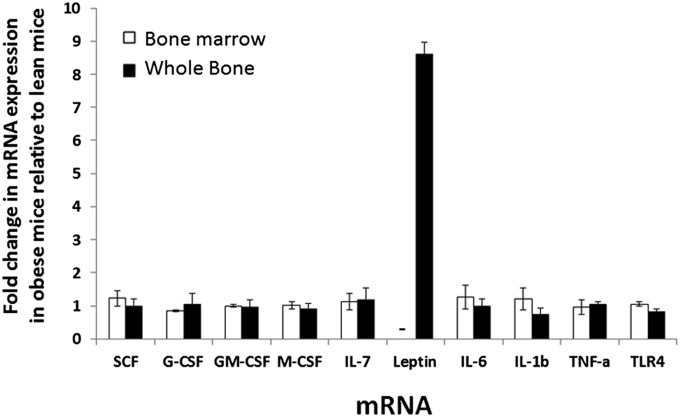
Fig. 7.
Analysis of expression of various genes in isolated bone marrow cells that would not contain adipocytes because of processing method and whole bone that would contain adipocytes from HFD mice. Total RNA was isolated bone marrow cells (white bars) and whole bone (black bars) and subjected to RT-PCR for relative quantitation of mRNA expression. Data shown represent expression of each mRNA in obese mice relative to expression in control lean mice. Data represent the average of two experiments for bone marrow and whole bone. For marrow, cells from days 142 and 165 on diet were used. For whole bone, femurs from days 157 and 165 were used. n = 8 per group at each time point. –, not detected.

