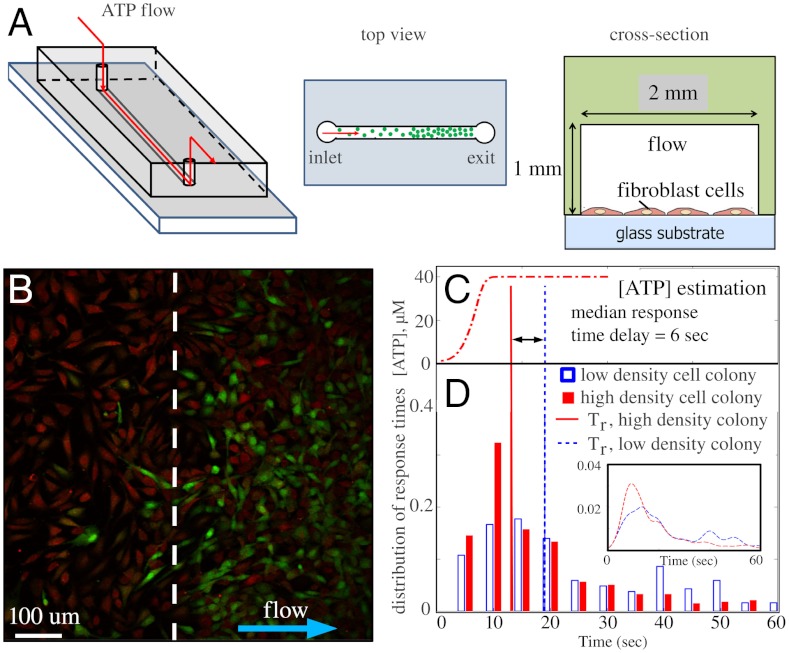
Fig. 1.
Excitation of fibroblast cells of nonuniform spatial density by ATP. (A) Schematics of the flow device. (B) An image from the calcium imaging fluorescent video during flow of ATP solution from the low cell density colony to the high cell density colony (separated by a dashed line). Red: reference fluorescence showing cell locations. Green: fluorescent signal from calcium indicator above the reference level. (C) Temporal profile of ATP concentration estimated from fluorescent dye in the same flow conditions. (D) Histogram and probability distribution of individual cell response times for the two colonies of different densities (380 cells in the high density colony and 121 cells in the low density colony were sampled). The median response time Tr is 19 sec for the low density group and 13 sec for the high density group.

