Fig. 2.
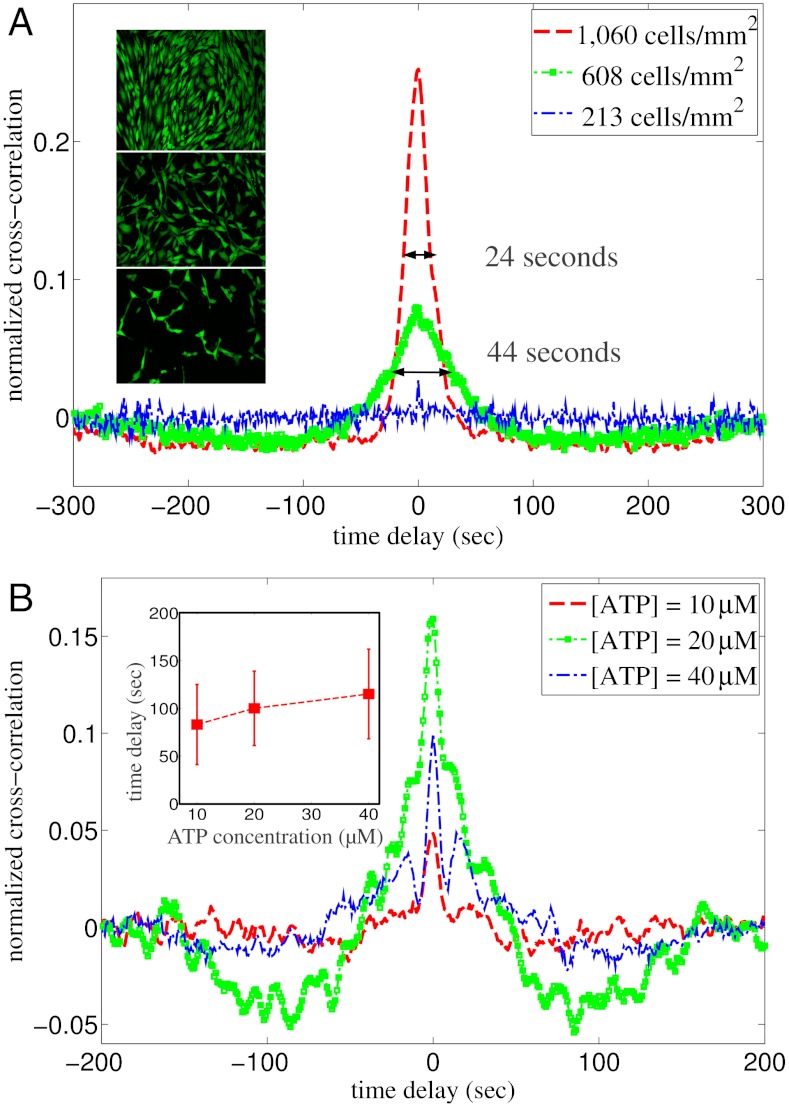
Averaged cross-correlations of nearest neighbors as a function of cell density and ATP concentration. (A) Normalized cross-correlation function  of nearest neighbors for cell colonies with different densities stimulated by 100 μM ATP in DMEM. The width of the central peak is 24 sec for the high density colony (1,060 cells/mm2) and 44 sec for the medium density colony (608 cells/mm2). At even lower density, the averaged cross-correlation function is almost featureless. Inset: representative images from the three experiments with different cell densities. (B) For densely packed cell colonies (approximately 1,000 cells/mm2), reducing the stimulating ATP concentration reveals clear negative correlations between nearest neighbors. Inset: the time delays of the peak negative correlation for different ATP concentrations. Each data point represents the mean value and standard deviation calculated from 4,000 cell pairs of four independent experiments (Movies S4–S15).

