Fig. 4.
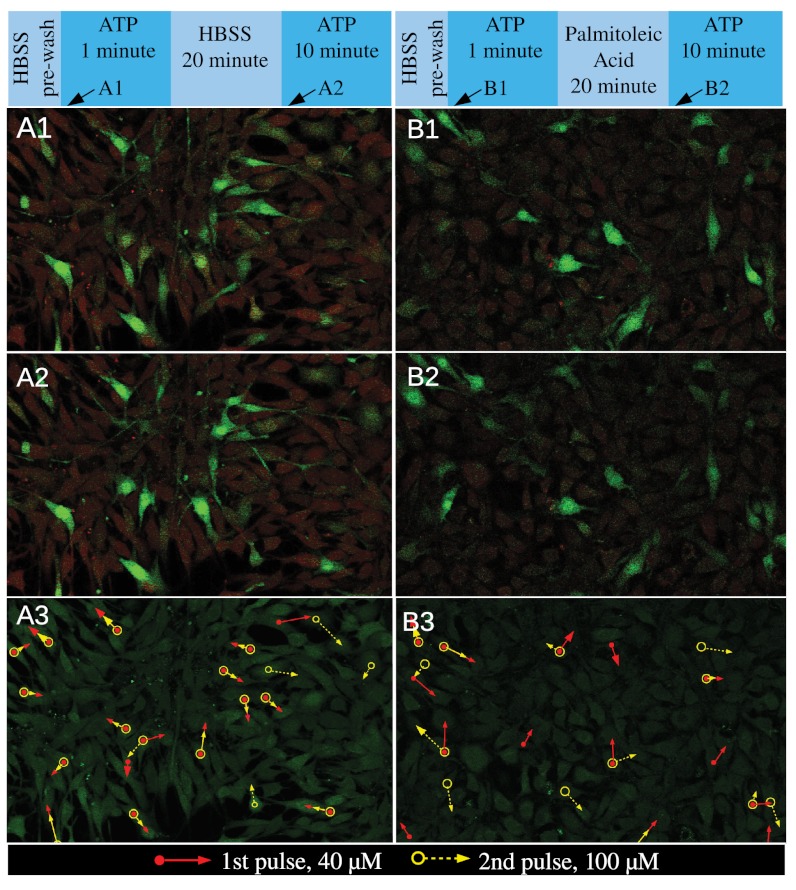
The role of pacemaker cells and gap junctions in the early state of group response. (A1–A3) The response of pacemakers in a densely packed cell colony. (A1) Red: baseline fluorescence of calcium imaging showing the location of cells. Green: fluorescent intensity beyond the baseline. The image was taken 5 sec after the first cell responded to a 40 μM ATP pulse, while the pulse of ATP lasted 1 min and was followed by HBSS to allow the cells to relax. (A2) Baseline and fluorescent intensity of the same colony as in A1. Image was taken 6 sec after the first cell responded to a 100 μM ATP pulse and the pulse lasted 10 min (Fig. S6). In between the ATP pulses of A1 and A2, cells were allowed to relax for 20 min within continuous flow of HBSS. (A3) Circle symbols label the cells that responded the fastest (pacemakers) in the two ATP pulses and the arrows point to the nearest-neighbor cells of the pacemakers that responded subsequently. Open circles: pacemakers of the second ATP pulse. Filled circles: pacemakers of the first ATP pulse. When the arrows overlap, only one is visible. Notice A1–A2 covers only the upper part of A3. B1–B3 is similar to A1–A3, except the cells were treated with palmitoleic acid for 20 min in between the two ATP pulses. Top insets: the temporal profile of the solution content delivered to the cell.

