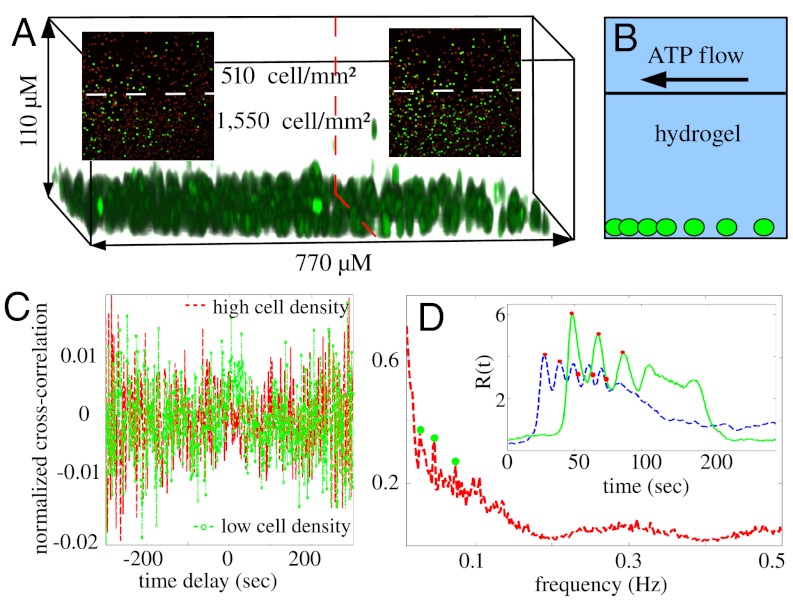
Fig. 5.
Characteristics of the collective responses when cells were encapsulated in hydrogel. (A) Confocal reconstruction of fibroblast cells embbeded in hydrogel. Due to sedimentation during the gelation process, most cells were near the bottom of the gel. Cell density was constructed stepwise (boundary indicated by the dashed line) and the external ATP flow was from the low density side to the high density side. Inset: snapshot of fluorescent images showing the calcium level beyond the baseline. No distinction of response time was observed for the two colonies. Left and right insets were taken 10 sec and 30 sec, respectively, after the cells started to respond to 100 μM ATP. (B) Schematics of the vertical structure of the device. (C) Averaged cross-correlation functions between nearest neighbors in the low density cell colony and high density cell colony as shown in A1. (D) Fourier spectrum of response curve averaged over the cells in the high density colony. Filled circles locate the peaks in the spectrum. Inset: Representative response curves of two cells in the high density colony. The curves cover 200 sec from the first cell in the colony started to respond.

