Fig. 1.
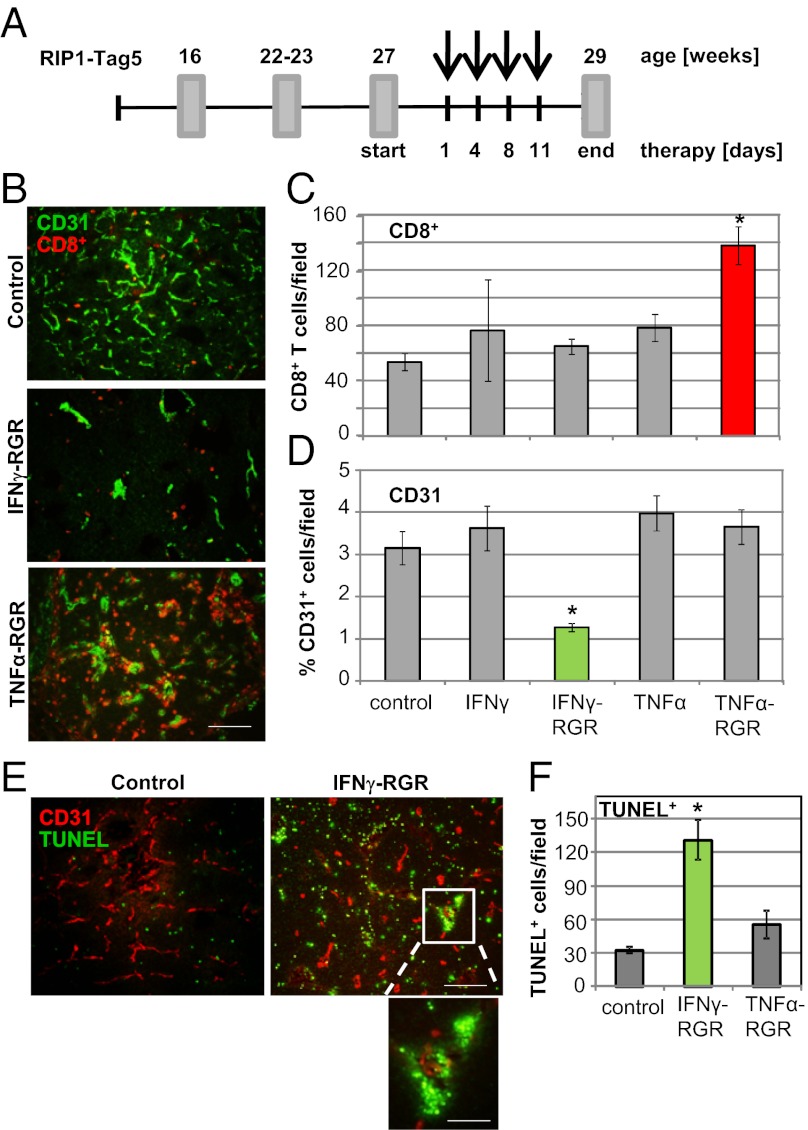
IFNγ and TNFα have distinct effects in the tumor microenvironment. (A) Schematic representation of a short-term treatment regimen in RIP1-Tag5 mice. Arrows indicate four i.v. injections of compounds. Tumors were analyzed at 29 wk. (B) Costaining of control (untreated), IFNγ–RGR and TNFα-RGR treated tumors with specific antibodies: CD8+ T cells, red; CD31+ blood vessels, green. Representative pictures after biweekly i.v. injections of 2 μg of IFNγ–RGR or TNFα-RGR for 2 wk are shown. (Original magnification: 20×) (Scale bar: 100 μm.) (C) Quantification of tumor-infiltrating CD8+ T cells (mean CD8+ T cells per field ± SE, n = 3–9, *P < 0.01 compared with all other groups). (D) Quantification of CD31-positive blood vessels (mean % of CD31-covered area/field ± SE, n = 4–6, *P ≤ 0.01 compared with all other treatment groups). (E) Costaining of CD31-positive blood vessels (red) with TUNEL+, apoptotic cells (green) in IFNγ–RGR treated tumors. (Original magnification: 10×) (Scale bar: 200 μm.) Inset shows clustering of apoptotic cells around a vessel. (Original magnification: 40×) (Scale bar: 50 μm.) (F) Quantification of apoptotic cells in different treatment groups (mean TUNEL+ cells per field ± SE, n = 3–7, *P = 0.02 compared with control and TNFα-RGR treated groups).

